

Our Services
Drone Thermal Inspection in Dubai: Complete Guide
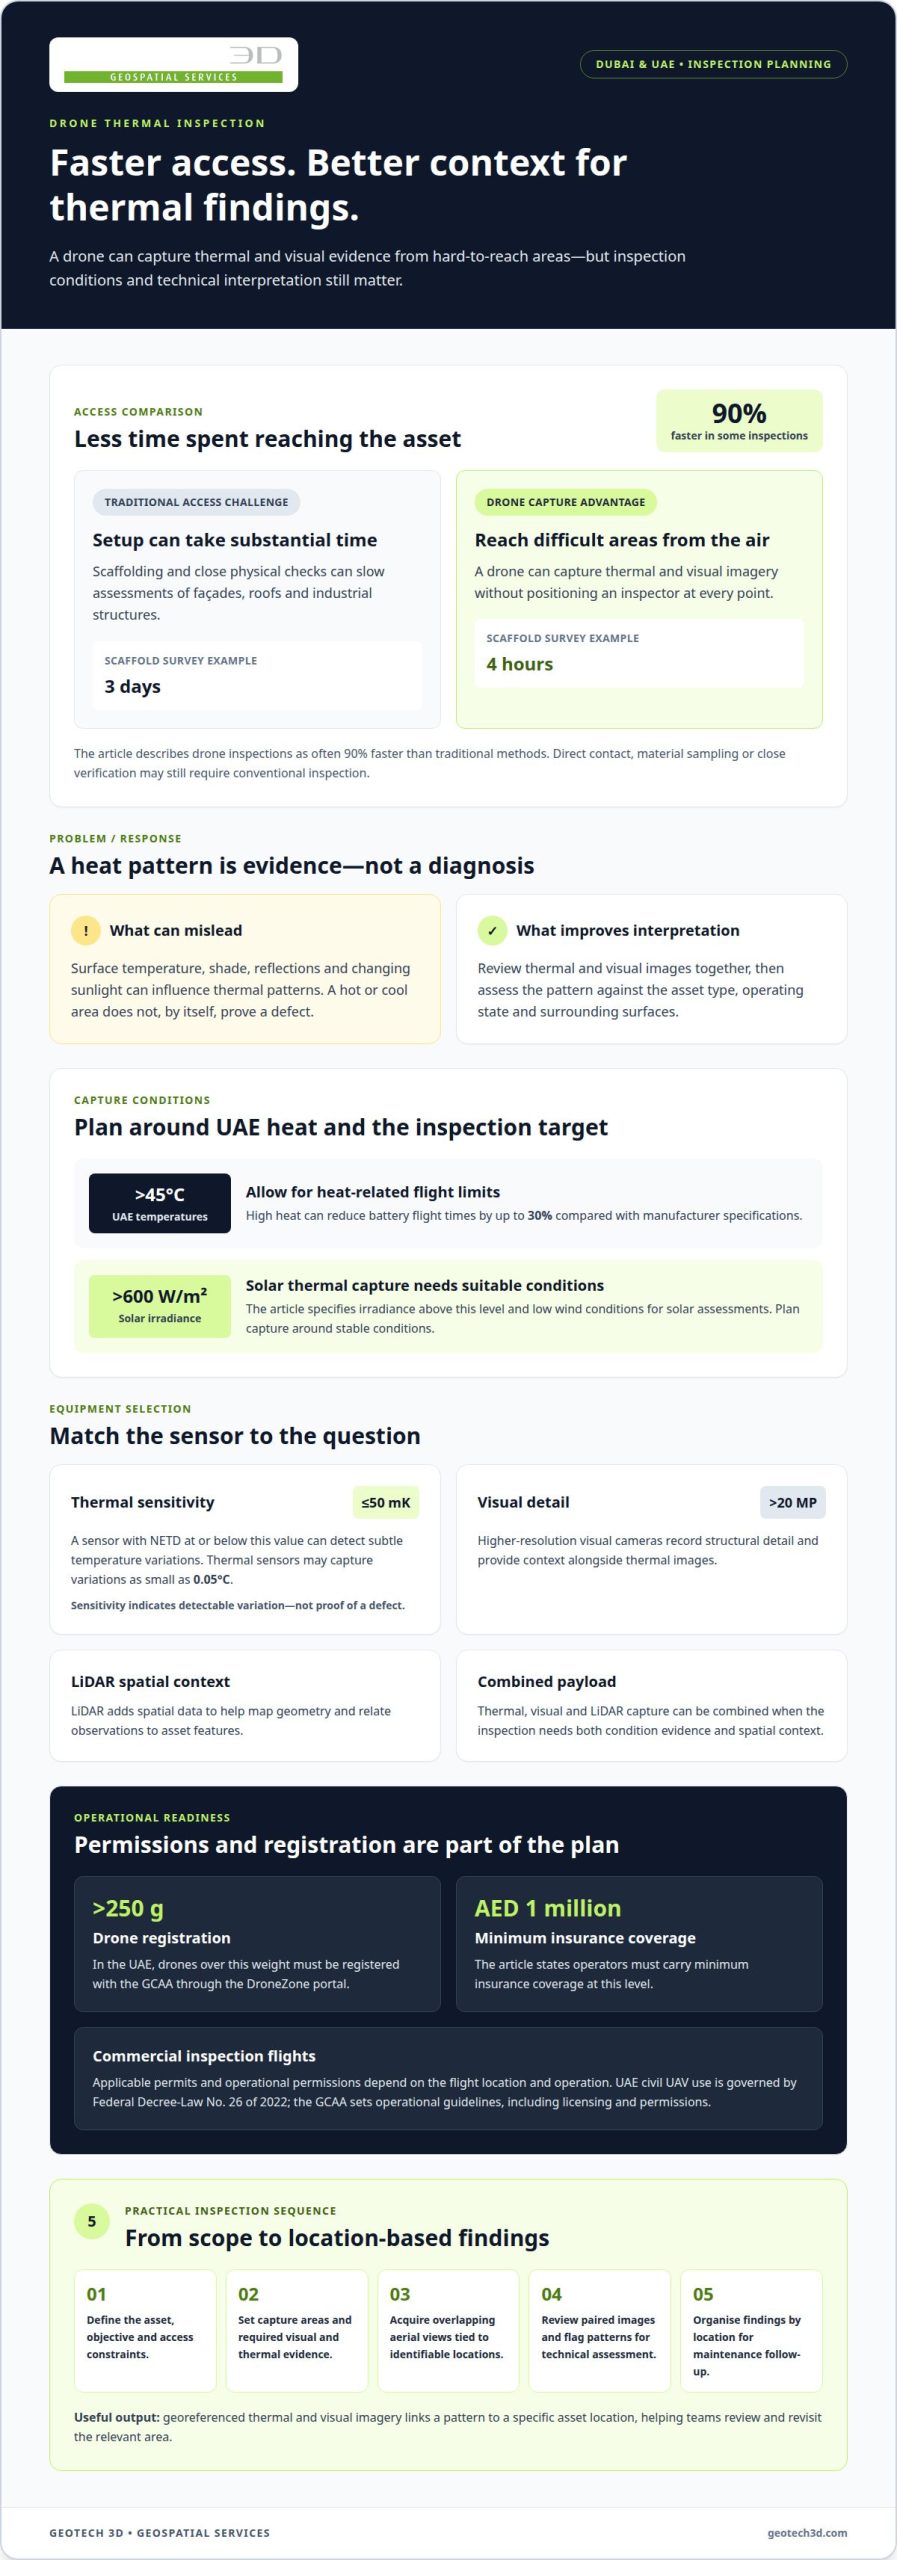
Traditional inspection methods can require access equipment, site setup and close physical checks. A drone thermal inspection in Dubai can often be 90% faster than traditional methods, while capturing thermal and visual data from hard-to-reach areas. It helps teams spot temperature patterns that may indicate faults, but the imagery still needs technical interpretation.
It is reasonable to ask whether faster inspections can provide findings that support real maintenance decisions. They can, when the survey is planned around the asset, suitable inspection conditions and clear reporting requirements. Thermal imagery is a diagnostic aid, not a substitute for every hands-on or electrical test.
This guide explains how drone-based thermal inspection compares with conventional access methods, what issues it can reveal, and how imagery and findings are reported and graded. It also covers façade inspection, where thermal views can help identify patterns of heat loss or irregularity across building elevations, and outlines practical factors for an effective inspection in Dubai and across the UAE.
Key Takeaways
- Match the drone and thermal sensor to the asset, inspection conditions and level of detail required.
- Use georeferenced visual and thermal imagery to connect detected patterns with specific locations on infrastructure.
- Structure inspection reports so teams can interpret anomalies, understand severity grades and plan follow-up work.
- Learn which industrial and solar asset faults may create detectable heat signatures, and where thermal analysis has limits.
- See how facade thermal surveys can help identify areas for closer assessment across building elevations.
How does drone-based thermal inspection compare to traditional methods?
Drone inspections can reduce access time where scaffolding or close physical checks would slow a construction assessment. They are often 90% faster than traditional methods, and scaffold surveys can take 4 hours instead of 3 days. That difference matters on facades, roofs and industrial structures, where access planning can occupy substantial project time. A drone also captures imagery from hard-to-reach locations without positioning an inspector at every point. Traditional methods remain useful when a defect needs direct contact, material sampling or close verification.
In the UAE, Federal Decree-Law No. 26 of 2022 governs civil UAV use, including permits, certificates, operator responsibilities and prohibited zones. The GCAA sets guidelines for drone operations, including licensing and operational permissions. These requirements make compliance part of inspection planning, alongside the asset and survey scope.
Commercial inspection flights require applicable permits and operational permissions, with requirements shaped by the flight location and operation. In the UAE, drones over 250 g must be registered with the GCAA through the DroneZone portal; operators must also carry minimum insurance coverage of AED 1 million.
Dubai weather and site conditions affect both flight planning and thermal readings. UAE temperatures regularly exceed 45°C, and high heat can reduce battery flight times by up to 30% compared with manufacturer specifications. For solar assessments, thermal capture requires solar irradiance above 600 W/m² and low wind conditions. Asset surface temperature, shade, reflections and changing sunlight can also influence the thermal pattern, so teams plan capture around stable conditions.
Choose thermal equipment for the target fault, not simply the highest specification. A sensor with NETD ≤50 mK can detect subtle temperature variations, while thermal sensors can capture variations as small as 0.05°C. These values describe sensitivity, not proof of a defect. A hot or cool area needs interpretation against the asset type, operating state and surrounding surfaces.
Visual cameras add context to thermal readings. Cameras exceeding 20 megapixels can record detailed structural imagery, while thermal cameras show heat patterns that ordinary images cannot. LiDAR adds spatial data, helping map geometry and relate observations to asset features. A multi-sensor payload can combine thermal, visual and LiDAR capture when the inspection requires both condition evidence and spatial context. Sensor selection should reflect the site, required precision and intended applications.
- Define the asset, inspection objective and access constraints before selecting equipment.
- Match thermal sensitivity and visual detail to the anomalies the assessment must reveal.
- Plan permissions, registration and weather conditions before scheduling the flight.
Georeferenced visual and thermal infrastructure imagery
Georeferenced imagery links each visual or thermal observation to a location on an asset. For a bridge, railway or building façade, that link helps teams find the imaged area again during maintenance. Drone inspection systems can combine visual and thermal views, with georeferenced bridge and railway imagery pinpointing faults to the centimetre. This precision supports location-based assessment instead of leaving teams to interpret an isolated heat pattern.
Visual imagery shows surface context, such as cracks, staining, loose components or façade details. Infrared imagery records temperature patterns that may indicate energy loss or a concealed anomaly. Review both images together: the thermal contrast identifies an area for attention, while the corresponding visual frame shows its position and surroundings. This makes observations easier to interpret and communicate across project teams.
Dubai façade inspections demonstrate how aerial capture can address difficult elevations. Thermal and visual drone cameras have been used to inspect 21-storey buildings at Deira Waterfront for façade energy loss. The same paired approach can help assess cladding, roof interfaces and other exterior areas. It records broad elevations without requiring an inspector to examine every point from close range.
Drone thermal imaging inspections in Dubai are provided by surveying and asset-inspection firms with aerial capture capabilities. To define a useful scope, identify the structure, areas of concern and required outputs. Then align the flight plan with access conditions and the intended assessment. These steps clarify whether the project needs visual records, thermal comparisons, georeferenced outputs or a combination.
A practical inspection workflow moves from planning to review:
- Define the asset and inspection objective, such as locating façade heat-loss patterns.
- Set the areas to capture and the visual and thermal evidence required.
- Acquire overlapping aerial views that can be tied to identifiable asset locations.
- Review corresponding images and flag patterns needing technical assessment.
- Organise findings by location so maintenance teams can act on them.
For example, a thermal image may show an irregular patch across a building elevation. The paired visual frame and georeferenced position help the team identify the relevant façade section. The observation can then be compared with adjacent areas and recorded for follow-up. Thermal imagery shows a pattern, not its cause, so interpretation should account for the asset and inspection conditions.
Clear capture planning also improves efficiency. Specify whether the deliverable should support asset records, maintenance planning or a later site assessment. When location-based aerial data is central to the project, explore drone-based surveying as part of the workflow.
Inspection reporting and defect severity grading
A useful inspection report turns thermal detections into clear maintenance decisions. It should identify each anomaly, show its location, preserve the supporting imagery and explain its assigned priority. For a solar array, a report might link a thermal pattern to a particular panel or group of panels, then include a visual frame for context. Engineering teams can use this record to plan investigation, repairs or monitoring.
Severity grading helps asset teams distinguish critical findings from observations for routine review. A project can define practical categories such as critical, high priority and monitor, with criteria agreed before deployment. For example, a critical grade may flag a finding that needs prompt technical assessment, while a monitor grade records a pattern for comparison during later inspections. The grade should indicate urgency, not claim that imaging has confirmed a cause.
Each finding should include enough information for a reviewer to locate and assess it:
- Asset name, component or panel reference.
- Georeferenced position and matching visual image.
- Thermal image, observed pattern and relevant capture conditions.
- Severity grade, recommended next action and review status.
Resolution affects what a report can show. A broad overview helps teams understand how findings are distributed across an asset, while close imagery supports review of a specific feature. The report should distinguish observed evidence from interpretation. For instance, it can record an unusual temperature pattern on a panel as a detection, then recommend electrical testing to establish its cause. This separation keeps engineering decisions traceable.
In Dubai, safety, privacy and data risks include flight hazards around people, buildings and active work areas, as well as capturing identifiable private spaces. Plan the flight path to limit unnecessary capture, restrict access to raw imagery and share inspection files only with authorised project personnel. These steps also help protect commercially sensitive asset information.
Drone findings can be integrated with engineering reports using consistent asset identifiers, location references and image labels. If a maintenance register uses a building, façade zone or panel reference, use the same identifier in the inspection record. This link lets engineers compare findings with drawings, work orders and earlier assessments without manually matching unrelated descriptions.
Timelines depend on capture scope, asset access, image processing and report detail. At Al Dhafra Solar Park, inspection flights were completed in less than one week, and the team generated a comprehensive report in 10 days. Those project figures show that flight completion and final reporting are separate stages. Agreeing deliverables early helps teams plan reviews and maintenance decisions.
Before deployment, define the reporting format, grading criteria and intended users. A concise executive summary can highlight critical items, while an evidence register supports technical review. This gives project managers a clear overview and engineers the imaging detail needed to investigate individual findings.
What faults can thermal inspection detect?
Thermal inspection identifies temperature patterns that can indicate abnormal asset conditions. In solar installations, these patterns can reveal electrical faults from string level down to individual cells.
Thermal Anomaly Mapping
Radiometric thermal capture records temperature values across an image, allowing analysts to compare areas rather than rely on colour alone. A map can show where an unusual pattern appears on a structure or industrial asset, helping teams track it during condition monitoring. Review the anomaly’s location, shape and surrounding temperatures, then compare similar components under comparable operating conditions.
For structural monitoring, an isolated warm or cool area is an observation, not a diagnosis. A façade, roof or process asset may show patterns associated with heat transfer or differing surface conditions. Pair each mapped anomaly with the asset location and visual context. This gives engineers a repeatable reference for follow-up inspections and helps distinguish a localised change from a broader pattern.
Electrical Hotspots and Fault Identification
Electrical faults can produce heat signatures while equipment is operating. Solar thermal inspection is performed while panels are under load, allowing faults to appear as thermal patterns. Analysis can identify issues from string level down to individual cells. Inspectors should compare affected components with neighbouring units and record the operating context, rather than treating every temperature difference as a confirmed failure.
Across industrial assets, thermal imaging can highlight abnormal heat around electrical connections, equipment or operating components. Its practical value is helping teams detect areas that need investigation, potentially addressing issues before unplanned downtime. A hotspot alone does not establish the cause. Engineers may need electrical testing or physical inspection to determine whether a component is faulty.
Radiometric analysis is most useful when capture conditions and asset state are documented. Record whether equipment was operating, note relevant environmental conditions and preserve thermal and visual evidence together. Reflections, surface properties and changing loads can influence apparent temperatures. Comparing similar components under similar conditions provides a stronger basis for analysis than relying on a single isolated reading.
AI-assisted analysis can help sort large image sets and flag patterns for review. For example, software may highlight a panel that differs from surrounding panels, allowing an analyst to prioritise that location. AI supports detection, but it does not replace engineering judgement or establish the cause of a fault. Review flagged anomalies against imagery, asset records and operating conditions before assigning maintenance action.
A practical assessment separates evidence from interpretation:
- Map the anomaly to a specific component or asset location.
- Compare it with equivalent components and operating conditions.
- Record the observed thermal pattern and supporting visual evidence.
- Recommend further testing where the heat signature indicates concern.
These methods help teams target follow-up work across Dubai’s infrastructure and industrial sites. Thermal capture can indicate where closer assessment may be useful, while electrical testing or physical checks establish the underlying fault and appropriate response.
Drone thermal imaging for facade inspection
Dubai’s high-rise facades present access and coverage challenges for close visual checks. A drone equipped with thermal and visual cameras can capture exterior surfaces from the air, helping teams review heat patterns alongside visible conditions. The One Zabeel facade inspection involved a 300-meter structure in Dubai, illustrating the scale of buildings where aerial capture can support assessment. Thermal images show temperature variation; they do not, by themselves, establish the cause.
Façade surveying starts by defining the elevations and features to inspect. Teams can plan coverage around cladding, window assemblies, roof edges and transitions between materials. Thermal imagery can highlight areas with contrasting surface temperatures, while matching visual frames show their physical context. This paired evidence helps engineers identify locations for closer examination and compare related sections of the same façade.
Environmental conditions affect how façade images should be interpreted. Direct sun, shade, reflections, wind and changing surface temperatures can alter the thermal pattern captured during a flight. A planned survey therefore considers the building’s orientation, capture timing and surface conditions. For example, comparing a shaded wall section with a sunlit section without context can lead to misleading conclusions.
Drone capture can also reduce the need to position personnel directly beside difficult elevations. This is useful for reviewing high or awkward areas where ground-based viewing provides limited detail. It does not replace every close inspection: visible damage, suspected material failure or a thermal anomaly requiring diagnosis may need follow-up assessment at the structure.
A practical façade workflow keeps the evidence traceable from capture to review:
- Define the building elevations and inspection objective before flight planning.
- Capture overlapping thermal and visual views of each selected facade area.
- Record each observation against a clear elevation or building reference.
- Compare thermal patterns with visible features and relevant environmental conditions.
- Prioritise locations for engineering review or closer ground assessment.
Inspection reports should distinguish measured patterns from conclusions. A report can mark an area with contrasting temperatures, provide its façade reference and include the corresponding visual frame. Engineers can then assess whether further inspection is warranted, considering the building materials, exposure and surrounding conditions. This makes findings easier to discuss across asset and maintenance teams without overstating what thermal imaging proves.
For a Dubai façade assessment, specify the elevations, required imagery and reporting references before the survey begins. A clear scope helps align aerial capture with the project’s maintenance or condition-monitoring needs.
GEOTECH 3D: topo survey
GEOTECH 3D can support projects that need site context alongside aerial inspection findings. Its topo survey captures ground features and site levels, helping project teams understand the surrounding terrain when planning construction, access or asset works. For building assessments, Drone Services can gather aerial data, while 3D Laser Scanning and GIS & Surveying Services support other spatial information needs.
Consider a topo survey when façade findings form part of a wider site-planning or development scope, rather than requiring thermal interpretation alone. The appropriate survey depends on the decisions the data must support and the site information required.
Contact GEOTECH 3D to discuss your survey requirements, or visit geotech3d.com.
Turn inspection findings into a clear next step
A successful survey starts with the decision the data needs to support. Before arranging a drone thermal inspection in Dubai, define the asset, the concern under review and who will use the findings. This keeps capture and reporting aligned with practical priorities, whether the team is planning maintenance, documenting a condition or identifying areas for further assessment.
Set out the required deliverables and explain how findings should connect with existing asset records. Agreeing these points early helps project teams turn collected imagery into a usable work plan. It also gives engineers and asset managers a shared basis for reviewing observations and assigning follow-up actions.
GEOTECH 3D can discuss how its surveying capabilities fit your project scope and information needs. Share the asset context and the decisions you need the survey to inform, then shape the next step around those requirements.
A well-scoped survey gives your team a more direct path from site information to informed action.
Frequently Asked Questions
What industries benefit from drone thermography?
Industries with large, complex or difficult-to-access assets can use drone thermography to support condition reviews. Examples include marine and naval construction, mining operations, heritage facilities and oil and gas sites. At a mining operation, a thermal survey could direct attention to selected equipment or structures. Define the inspection objective around the asset’s operating context and the maintenance decision, rather than applying the same survey scope to every sector.
What technology do these drones use?
Thermal cameras detect infrared energy and present temperature differences as an image. Interpreting that image requires more than reading its colour palette: surface emissivity, reflected energy and camera settings affect the displayed values. A competent analysis records relevant settings and considers the material being observed. For example, a reflective metal surface may need different interpretation from a painted wall, even when both show similar apparent temperatures.
What services do drone thermal inspection companies offer in Dubai?
For a drone thermal inspection in Dubai, service scopes can vary by asset and required output. GEOTECH 3D’s Drone Services include aerial inspection for thermal, façade, solar panel, confined-space and shafts-over-ceiling applications. The last two can be relevant where overhead or restricted areas are difficult to assess from the ground. A defined scope should identify the inspection area and the intended use of the resulting data.
What can drone thermal inspections detect in buildings and infrastructure?
Thermal imagery can highlight surface temperature differences and help direct further investigation. It cannot see through opaque building materials or establish the condition of concealed components by itself. For example, an unusual pattern on a wall may warrant a closer building-envelope review, but the image alone cannot identify the material defect. Treat thermal findings as indicators for targeted follow-up, then use suitable inspection methods to assess the underlying condition.
How do drone thermal inspections compare with handheld or satellite inspections?
The main choice is the scale and viewpoint required. A handheld camera suits a close review of an accessible component, while a drone can document exterior areas from an aerial viewpoint. Satellite imagery is more useful for broader geographic context than for detailed inspection of an individual component. For repeat assessments, keep asset references and the capture approach consistent so reviewers can compare observations meaningfully over time.
What qualifications and equipment should a Dubai thermal drone inspection provider have?
Effective work requires competent flight operations and the ability to interpret thermal evidence in context. The team should understand the inspection target, record relevant capture settings and distinguish measured patterns from engineering conclusions. Equipment should suit the asset and produce files that can be reviewed after the flight. For example, a project brief can specify image formats, asset references and the information engineers need for later assessment.
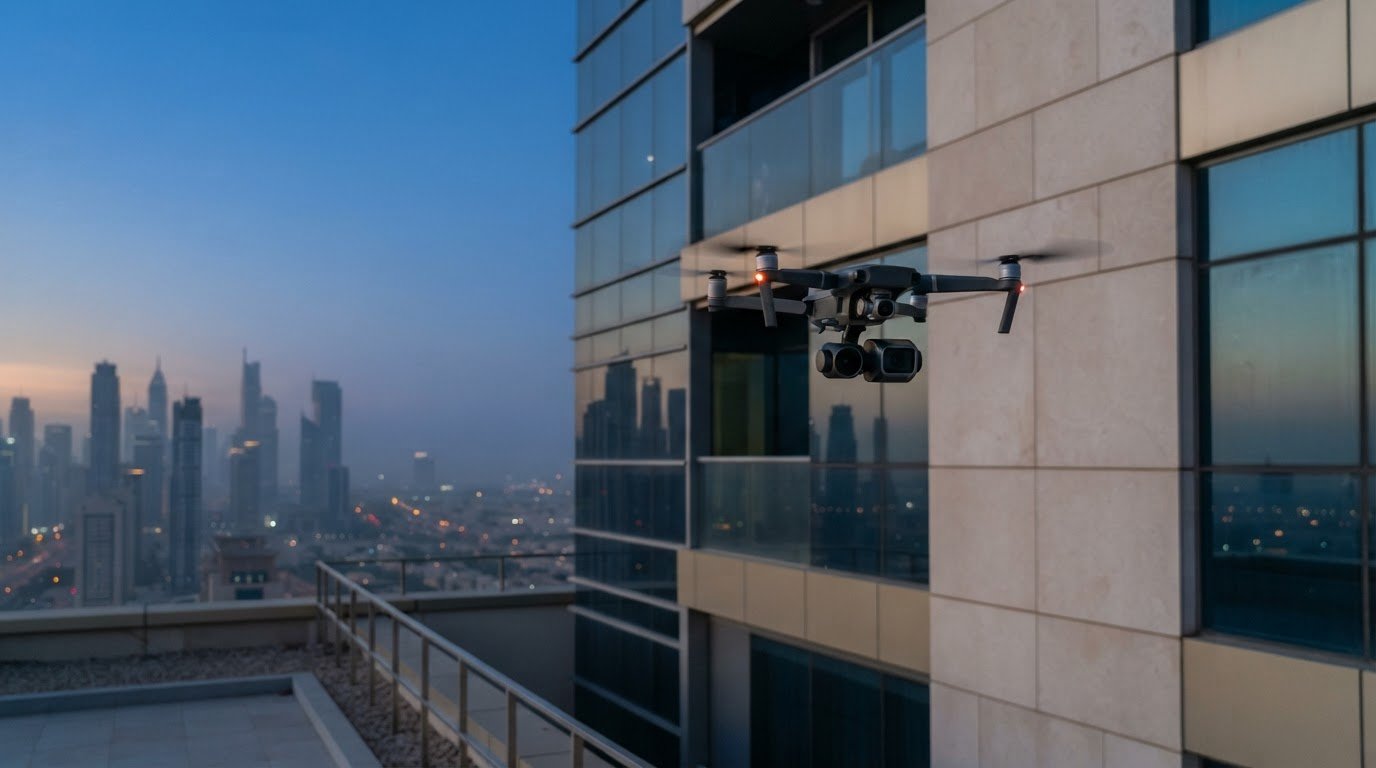
Traditional inspection methods can require access equipment, site setup and close physical checks. A drone thermal inspection in Dubai can often be 90% faster than traditional methods, while capturing thermal and visual data from hard-to-reach areas. It helps teams spot temperature patterns that may indicate faults, but the imagery still needs technical interpretation.
It is reasonable to ask whether faster inspections can provide findings that support real maintenance decisions. They can, when the survey is planned around the asset, suitable inspection conditions and clear reporting requirements. Thermal imagery is a diagnostic aid, not a substitute for every hands-on or electrical test.
This guide explains how drone-based thermal inspection compares with conventional access methods, what issues it can reveal, and how imagery and findings are reported and graded. It also covers façade inspection, where thermal views can help identify patterns of heat loss or irregularity across building elevations, and outlines practical factors for an effective inspection in Dubai and across the UAE.
Key Takeaways
- Match the drone and thermal sensor to the asset, inspection conditions and level of detail required.
- Use georeferenced visual and thermal imagery to connect detected patterns with specific locations on infrastructure.
- Structure inspection reports so teams can interpret anomalies, understand severity grades and plan follow-up work.
- Learn which industrial and solar asset faults may create detectable heat signatures, and where thermal analysis has limits.
- See how facade thermal surveys can help identify areas for closer assessment across building elevations.
How does drone-based thermal inspection compare to traditional methods?
Drone inspections can reduce access time where scaffolding or close physical checks would slow a construction assessment. They are often 90% faster than traditional methods, and scaffold surveys can take 4 hours instead of 3 days. That difference matters on facades, roofs and industrial structures, where access planning can occupy substantial project time. A drone also captures imagery from hard-to-reach locations without positioning an inspector at every point. Traditional methods remain useful when a defect needs direct contact, material sampling or close verification.
In the UAE, Federal Decree-Law No. 26 of 2022 governs civil UAV use, including permits, certificates, operator responsibilities and prohibited zones. The GCAA sets guidelines for drone operations, including licensing and operational permissions. These requirements make compliance part of inspection planning, alongside the asset and survey scope.
Commercial inspection flights require applicable permits and operational permissions, with requirements shaped by the flight location and operation. In the UAE, drones over 250 g must be registered with the GCAA through the DroneZone portal; operators must also carry minimum insurance coverage of AED 1 million.
Dubai weather and site conditions affect both flight planning and thermal readings. UAE temperatures regularly exceed 45°C, and high heat can reduce battery flight times by up to 30% compared with manufacturer specifications. For solar assessments, thermal capture requires solar irradiance above 600 W/m² and low wind conditions. Asset surface temperature, shade, reflections and changing sunlight can also influence the thermal pattern, so teams plan capture around stable conditions.
Choose thermal equipment for the target fault, not simply the highest specification. A sensor with NETD ≤50 mK can detect subtle temperature variations, while thermal sensors can capture variations as small as 0.05°C. These values describe sensitivity, not proof of a defect. A hot or cool area needs interpretation against the asset type, operating state and surrounding surfaces.
Visual cameras add context to thermal readings. Cameras exceeding 20 megapixels can record detailed structural imagery, while thermal cameras show heat patterns that ordinary images cannot. LiDAR adds spatial data, helping map geometry and relate observations to asset features. A multi-sensor payload can combine thermal, visual and LiDAR capture when the inspection requires both condition evidence and spatial context. Sensor selection should reflect the site, required precision and intended applications.
- Define the asset, inspection objective and access constraints before selecting equipment.
- Match thermal sensitivity and visual detail to the anomalies the assessment must reveal.
- Plan permissions, registration and weather conditions before scheduling the flight.
Georeferenced visual and thermal infrastructure imagery
Georeferenced imagery links each visual or thermal observation to a location on an asset. For a bridge, railway or building façade, that link helps teams find the imaged area again during maintenance. Drone inspection systems can combine visual and thermal views, with georeferenced bridge and railway imagery pinpointing faults to the centimetre. This precision supports location-based assessment instead of leaving teams to interpret an isolated heat pattern.
Visual imagery shows surface context, such as cracks, staining, loose components or façade details. Infrared imagery records temperature patterns that may indicate energy loss or a concealed anomaly. Review both images together: the thermal contrast identifies an area for attention, while the corresponding visual frame shows its position and surroundings. This makes observations easier to interpret and communicate across project teams.
Dubai façade inspections demonstrate how aerial capture can address difficult elevations. Thermal and visual drone cameras have been used to inspect 21-storey buildings at Deira Waterfront for façade energy loss. The same paired approach can help assess cladding, roof interfaces and other exterior areas. It records broad elevations without requiring an inspector to examine every point from close range.
Drone thermal imaging inspections in Dubai are provided by surveying and asset-inspection firms with aerial capture capabilities. To define a useful scope, identify the structure, areas of concern and required outputs. Then align the flight plan with access conditions and the intended assessment. These steps clarify whether the project needs visual records, thermal comparisons, georeferenced outputs or a combination.
A practical inspection workflow moves from planning to review:
- Define the asset and inspection objective, such as locating façade heat-loss patterns.
- Set the areas to capture and the visual and thermal evidence required.
- Acquire overlapping aerial views that can be tied to identifiable asset locations.
- Review corresponding images and flag patterns needing technical assessment.
- Organise findings by location so maintenance teams can act on them.
For example, a thermal image may show an irregular patch across a building elevation. The paired visual frame and georeferenced position help the team identify the relevant façade section. The observation can then be compared with adjacent areas and recorded for follow-up. Thermal imagery shows a pattern, not its cause, so interpretation should account for the asset and inspection conditions.
Clear capture planning also improves efficiency. Specify whether the deliverable should support asset records, maintenance planning or a later site assessment. When location-based aerial data is central to the project, explore drone-based surveying as part of the workflow.
Inspection reporting and defect severity grading
A useful inspection report turns thermal detections into clear maintenance decisions. It should identify each anomaly, show its location, preserve the supporting imagery and explain its assigned priority. For a solar array, a report might link a thermal pattern to a particular panel or group of panels, then include a visual frame for context. Engineering teams can use this record to plan investigation, repairs or monitoring.
Severity grading helps asset teams distinguish critical findings from observations for routine review. A project can define practical categories such as critical, high priority and monitor, with criteria agreed before deployment. For example, a critical grade may flag a finding that needs prompt technical assessment, while a monitor grade records a pattern for comparison during later inspections. The grade should indicate urgency, not claim that imaging has confirmed a cause.
Each finding should include enough information for a reviewer to locate and assess it:
- Asset name, component or panel reference.
- Georeferenced position and matching visual image.
- Thermal image, observed pattern and relevant capture conditions.
- Severity grade, recommended next action and review status.
Resolution affects what a report can show. A broad overview helps teams understand how findings are distributed across an asset, while close imagery supports review of a specific feature. The report should distinguish observed evidence from interpretation. For instance, it can record an unusual temperature pattern on a panel as a detection, then recommend electrical testing to establish its cause. This separation keeps engineering decisions traceable.
In Dubai, safety, privacy and data risks include flight hazards around people, buildings and active work areas, as well as capturing identifiable private spaces. Plan the flight path to limit unnecessary capture, restrict access to raw imagery and share inspection files only with authorised project personnel. These steps also help protect commercially sensitive asset information.
Drone findings can be integrated with engineering reports using consistent asset identifiers, location references and image labels. If a maintenance register uses a building, façade zone or panel reference, use the same identifier in the inspection record. This link lets engineers compare findings with drawings, work orders and earlier assessments without manually matching unrelated descriptions.
Timelines depend on capture scope, asset access, image processing and report detail. At Al Dhafra Solar Park, inspection flights were completed in less than one week, and the team generated a comprehensive report in 10 days. Those project figures show that flight completion and final reporting are separate stages. Agreeing deliverables early helps teams plan reviews and maintenance decisions.
Before deployment, define the reporting format, grading criteria and intended users. A concise executive summary can highlight critical items, while an evidence register supports technical review. This gives project managers a clear overview and engineers the imaging detail needed to investigate individual findings.
What faults can thermal inspection detect?
Thermal inspection identifies temperature patterns that can indicate abnormal asset conditions. In solar installations, these patterns can reveal electrical faults from string level down to individual cells.
Thermal Anomaly Mapping
Radiometric thermal capture records temperature values across an image, allowing analysts to compare areas rather than rely on colour alone. A map can show where an unusual pattern appears on a structure or industrial asset, helping teams track it during condition monitoring. Review the anomaly’s location, shape and surrounding temperatures, then compare similar components under comparable operating conditions.
For structural monitoring, an isolated warm or cool area is an observation, not a diagnosis. A façade, roof or process asset may show patterns associated with heat transfer or differing surface conditions. Pair each mapped anomaly with the asset location and visual context. This gives engineers a repeatable reference for follow-up inspections and helps distinguish a localised change from a broader pattern.
Electrical Hotspots and Fault Identification
Electrical faults can produce heat signatures while equipment is operating. Solar thermal inspection is performed while panels are under load, allowing faults to appear as thermal patterns. Analysis can identify issues from string level down to individual cells. Inspectors should compare affected components with neighbouring units and record the operating context, rather than treating every temperature difference as a confirmed failure.
Across industrial assets, thermal imaging can highlight abnormal heat around electrical connections, equipment or operating components. Its practical value is helping teams detect areas that need investigation, potentially addressing issues before unplanned downtime. A hotspot alone does not establish the cause. Engineers may need specialized non-destructive evaluation or physical testing from companies like International Testing Services Ltd to determine whether a component is faulty.
Radiometric analysis is most useful when capture conditions and asset state are documented. Record whether equipment was operating, note relevant environmental conditions and preserve thermal and visual evidence together. Reflections, surface properties and changing loads can influence apparent temperatures. Comparing similar components under similar conditions provides a stronger basis for analysis than relying on a single isolated reading.
AI-assisted analysis can help sort large image sets and flag patterns for review. For example, software may highlight a panel that differs from surrounding panels, allowing an analyst to prioritise that location. AI supports detection, but it does not replace engineering judgement or establish the cause of a fault. Review flagged anomalies against imagery, asset records and operating conditions before assigning maintenance action.
A practical assessment separates evidence from interpretation:
- Map the anomaly to a specific component or asset location.
- Compare it with equivalent components and operating conditions.
- Record the observed thermal pattern and supporting visual evidence.
- Recommend further testing where the heat signature indicates concern.
These methods help teams target follow-up work across Dubai’s infrastructure and industrial sites. Thermal capture can indicate where closer assessment may be useful, while electrical testing or physical checks establish the underlying fault and appropriate response.
Drone thermal imaging for facade inspection
Dubai’s high-rise facades present access and coverage challenges for close visual checks. A drone equipped with thermal and visual cameras can capture exterior surfaces from the air, helping teams review heat patterns alongside visible conditions. The One Zabeel facade inspection involved a 300-meter structure in Dubai, illustrating the scale of buildings where aerial capture can support assessment. Thermal images show temperature variation; they do not, by themselves, establish the cause.
Façade surveying starts by defining the elevations and features to inspect. Teams can plan coverage around cladding, window assemblies, roof edges and transitions between materials. Thermal imagery can highlight areas with contrasting surface temperatures, while matching visual frames show their physical context. This paired evidence helps engineers identify locations for closer examination and compare related sections of the same façade.
Environmental conditions affect how façade images should be interpreted. Direct sun, shade, reflections, wind and changing surface temperatures can alter the thermal pattern captured during a flight. A planned survey therefore considers the building’s orientation, capture timing and surface conditions. For example, comparing a shaded wall section with a sunlit section without context can lead to misleading conclusions.
Drone capture can also reduce the need to position personnel directly beside difficult elevations. This is useful for reviewing high or awkward areas where ground-based viewing provides limited detail. It does not replace every close inspection: visible damage, suspected material failure or a thermal anomaly requiring diagnosis may need follow-up assessment at the structure.
A practical façade workflow keeps the evidence traceable from capture to review:
- Define the building elevations and inspection objective before flight planning.
- Capture overlapping thermal and visual views of each selected facade area.
- Record each observation against a clear elevation or building reference.
- Compare thermal patterns with visible features and relevant environmental conditions.
- Prioritise locations for engineering review or closer ground assessment.
Inspection reports should distinguish measured patterns from conclusions. A report can mark an area with contrasting temperatures, provide its façade reference and include the corresponding visual frame. Engineers can then assess whether further inspection is warranted, considering the building materials, exposure and surrounding conditions. This makes findings easier to discuss across asset and maintenance teams without overstating what thermal imaging proves.
For a Dubai façade assessment, specify the elevations, required imagery and reporting references before the survey begins. A clear scope helps align aerial capture with the project’s maintenance or condition-monitoring needs.
GEOTECH 3D: topo survey
GEOTECH 3D can support projects that need site context alongside aerial inspection findings. Its topo survey captures ground features and site levels, helping project teams understand the surrounding terrain when planning construction, access or asset works. For building assessments, Drone Services can gather aerial data, while 3D Laser Scanning and GIS & Surveying Services support other spatial information needs.
Consider a topo survey when façade findings form part of a wider site-planning or development scope, rather than requiring thermal interpretation alone. The appropriate survey depends on the decisions the data must support and the site information required.
Contact GEOTECH 3D to discuss your survey requirements, or visit geotech3d.com.
Turn inspection findings into a clear next step
A successful survey starts with the decision the data needs to support. Before arranging a drone thermal inspection in Dubai, define the asset, the concern under review and who will use the findings. This keeps capture and reporting aligned with practical priorities, whether the team is planning maintenance, documenting a condition or identifying areas for further assessment.
Set out the required deliverables and explain how findings should connect with existing asset records. Agreeing these points early helps project teams turn collected imagery into a usable work plan. It also gives engineers and asset managers a shared basis for reviewing observations and assigning follow-up actions.
GEOTECH 3D can discuss how its surveying capabilities fit your project scope and information needs. Share the asset context and the decisions you need the survey to inform, then shape the next step around those requirements.
A well-scoped survey gives your team a more direct path from site information to informed action.
Frequently Asked Questions
What industries benefit from drone thermography?
Industries with large, complex or difficult-to-access assets can use drone thermography to support condition reviews. Examples include marine and naval construction, mining operations, heritage facilities and oil and gas sites. At a mining operation, a thermal survey could direct attention to selected equipment or structures. Define the inspection objective around the asset’s operating context and the maintenance decision, rather than applying the same survey scope to every sector.
What technology do these drones use?
Thermal cameras detect infrared energy and present temperature differences as an image. Interpreting that image requires more than reading its colour palette: surface emissivity, reflected energy and camera settings affect the displayed values. A competent analysis records relevant settings and considers the material being observed. For example, a reflective metal surface may need different interpretation from a painted wall, even when both show similar apparent temperatures.
What services do drone thermal inspection companies offer in Dubai?
For a drone thermal inspection in Dubai, service scopes can vary by asset and required output. GEOTECH 3D’s Drone Services include aerial inspection for thermal, façade, solar panel, confined-space and shafts-over-ceiling applications. The last two can be relevant where overhead or restricted areas are difficult to assess from the ground. A defined scope should identify the inspection area and the intended use of the resulting data.
What can drone thermal inspections detect in buildings and infrastructure?
Thermal imagery can highlight surface temperature differences and help direct further investigation. It cannot see through opaque building materials or establish the condition of concealed components by itself. For example, an unusual pattern on a wall may warrant a closer building-envelope review, but the image alone cannot identify the material defect. Treat thermal findings as indicators for targeted follow-up, then use suitable inspection methods to assess the underlying condition.
How do drone thermal inspections compare with handheld or satellite inspections?
The main choice is the scale and viewpoint required. A handheld camera suits a close review of an accessible component, while a drone can document exterior areas from an aerial viewpoint. Satellite imagery is more useful for broader geographic context than for detailed inspection of an individual component. For repeat assessments, keep asset references and the capture approach consistent so reviewers can compare observations meaningfully over time.
What qualifications and equipment should a Dubai thermal drone inspection provider have?
Effective work requires competent flight operations and the ability to interpret thermal evidence in context. The team should understand the inspection target, record relevant capture settings and distinguish measured patterns from engineering conclusions. Equipment should suit the asset and produce files that can be reviewed after the flight. For example, a project brief can specify image formats, asset references and the information engineers need for later assessment.
Search Now
Error: Contact form not found.