

Our Services
GIS Mapping Tools and Data for Dubai Projects
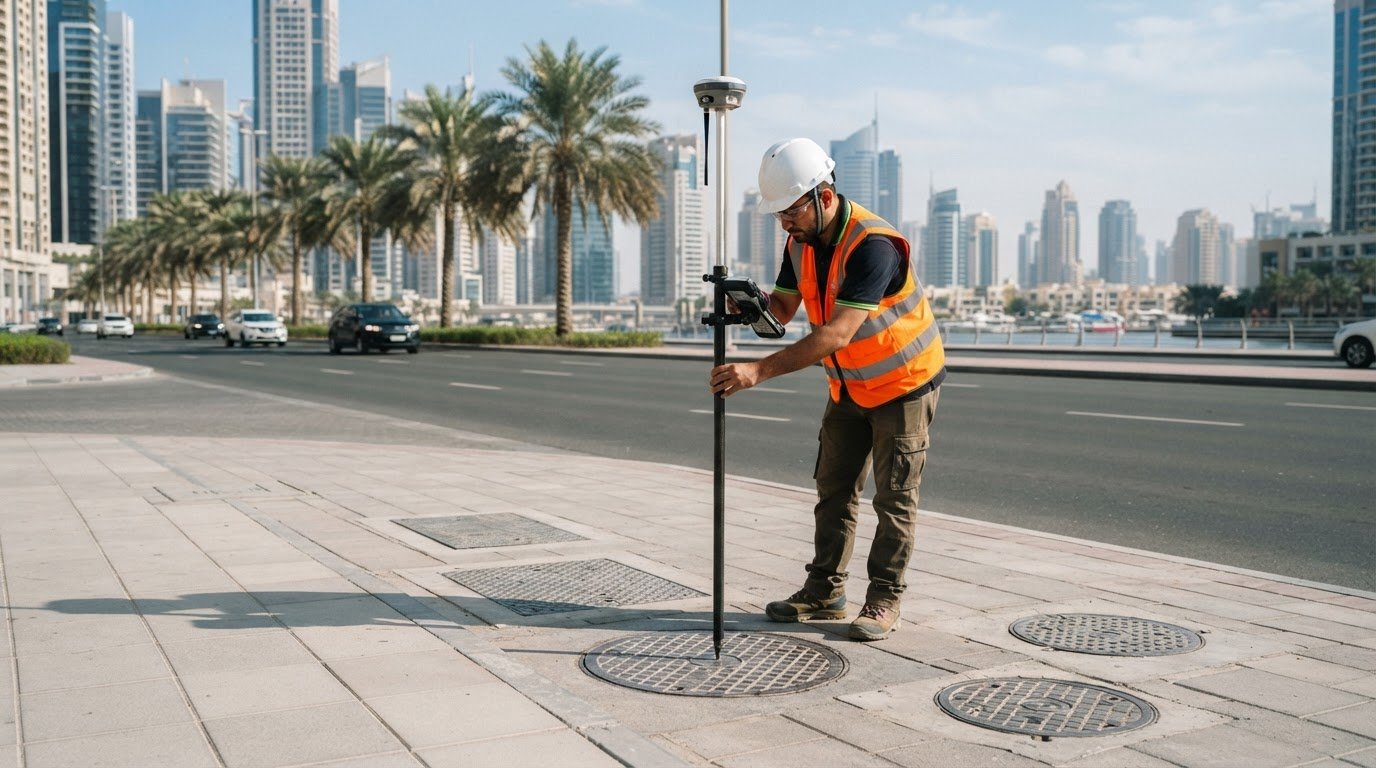
Better project decisions start with data that can be viewed together. GIS data collection and analysis in Dubai brings maps, survey information and asset records into a searchable format for visualisation and spatial analysis. By organising topography, utility lines, property boundaries and infrastructure as separate layers, GIS helps teams understand site conditions and how features relate.
For developers, contractors and consultants, this shared context matters. When information is scattered across separate records, it can be harder to assess constraints and coordinate planning. A well-structured GIS dataset gives project teams a practical way to explore spatial relationships and communicate findings.
This article explains how GIS mapping supports decision-making, which types of projects can benefit and how georeferencing, 3D data and file formats fit into a GIS workflow. It also outlines the role of data collection and analysis in turning site information into usable mapping outputs for projects across Dubai and the UAE.
Key Takeaways
- Combine survey data, maps and asset records to make site conditions easier to interpret and analyse.
- Use utility network mapping to view existing and proposed services in their spatial context.
- Bring 3D information into GIS when project decisions depend on understanding vertical as well as surface conditions.
- Georeferencing helps spatial datasets align, while clear data structures support reliable use across project workflows.
- Choose GIS deliverables and file formats around how teams will use, share and analyse the information.
Importance of accurate site data for Dubai developers
For GIS data collection and analysis in Dubai, accurate site data helps developers connect physical conditions with project records. A spatial database can bring survey information, asset records and maps into a searchable view. Topography, utility lines, property boundaries and infrastructure become separate layers, making relationships across a site easier to assess.
GIS database development starts by defining the project area, required features and attribute fields. A utility layer, for example, can record an asset’s type and status alongside its mapped location. Geodatabases and SHP files can store structured spatial layers and attributes, while metadata describes the dataset’s contents and context. Together, these elements help teams manage updates and interpret information consistently.
Drone survey permissions depend on the flight activity and location, while ground-based data collection depends on site access. Include an approvals review in the project plan before choosing a collection method. Do not assume one permission covers every site or activity.
For government and open data, Bayanat, the UAE national data portal, publishes geospatial and GIS datasets. The UAE’s 1Map initiative provides access to statistics and survey outputs through geospatial dashboards. Abu Dhabi’s Spatial Data Infrastructure Program focuses on sharing geospatial data among government agencies and stakeholders; it aims to advance the emirate towards SDI 3.0. These are national and Abu Dhabi resources, not a list of Dubai departments.
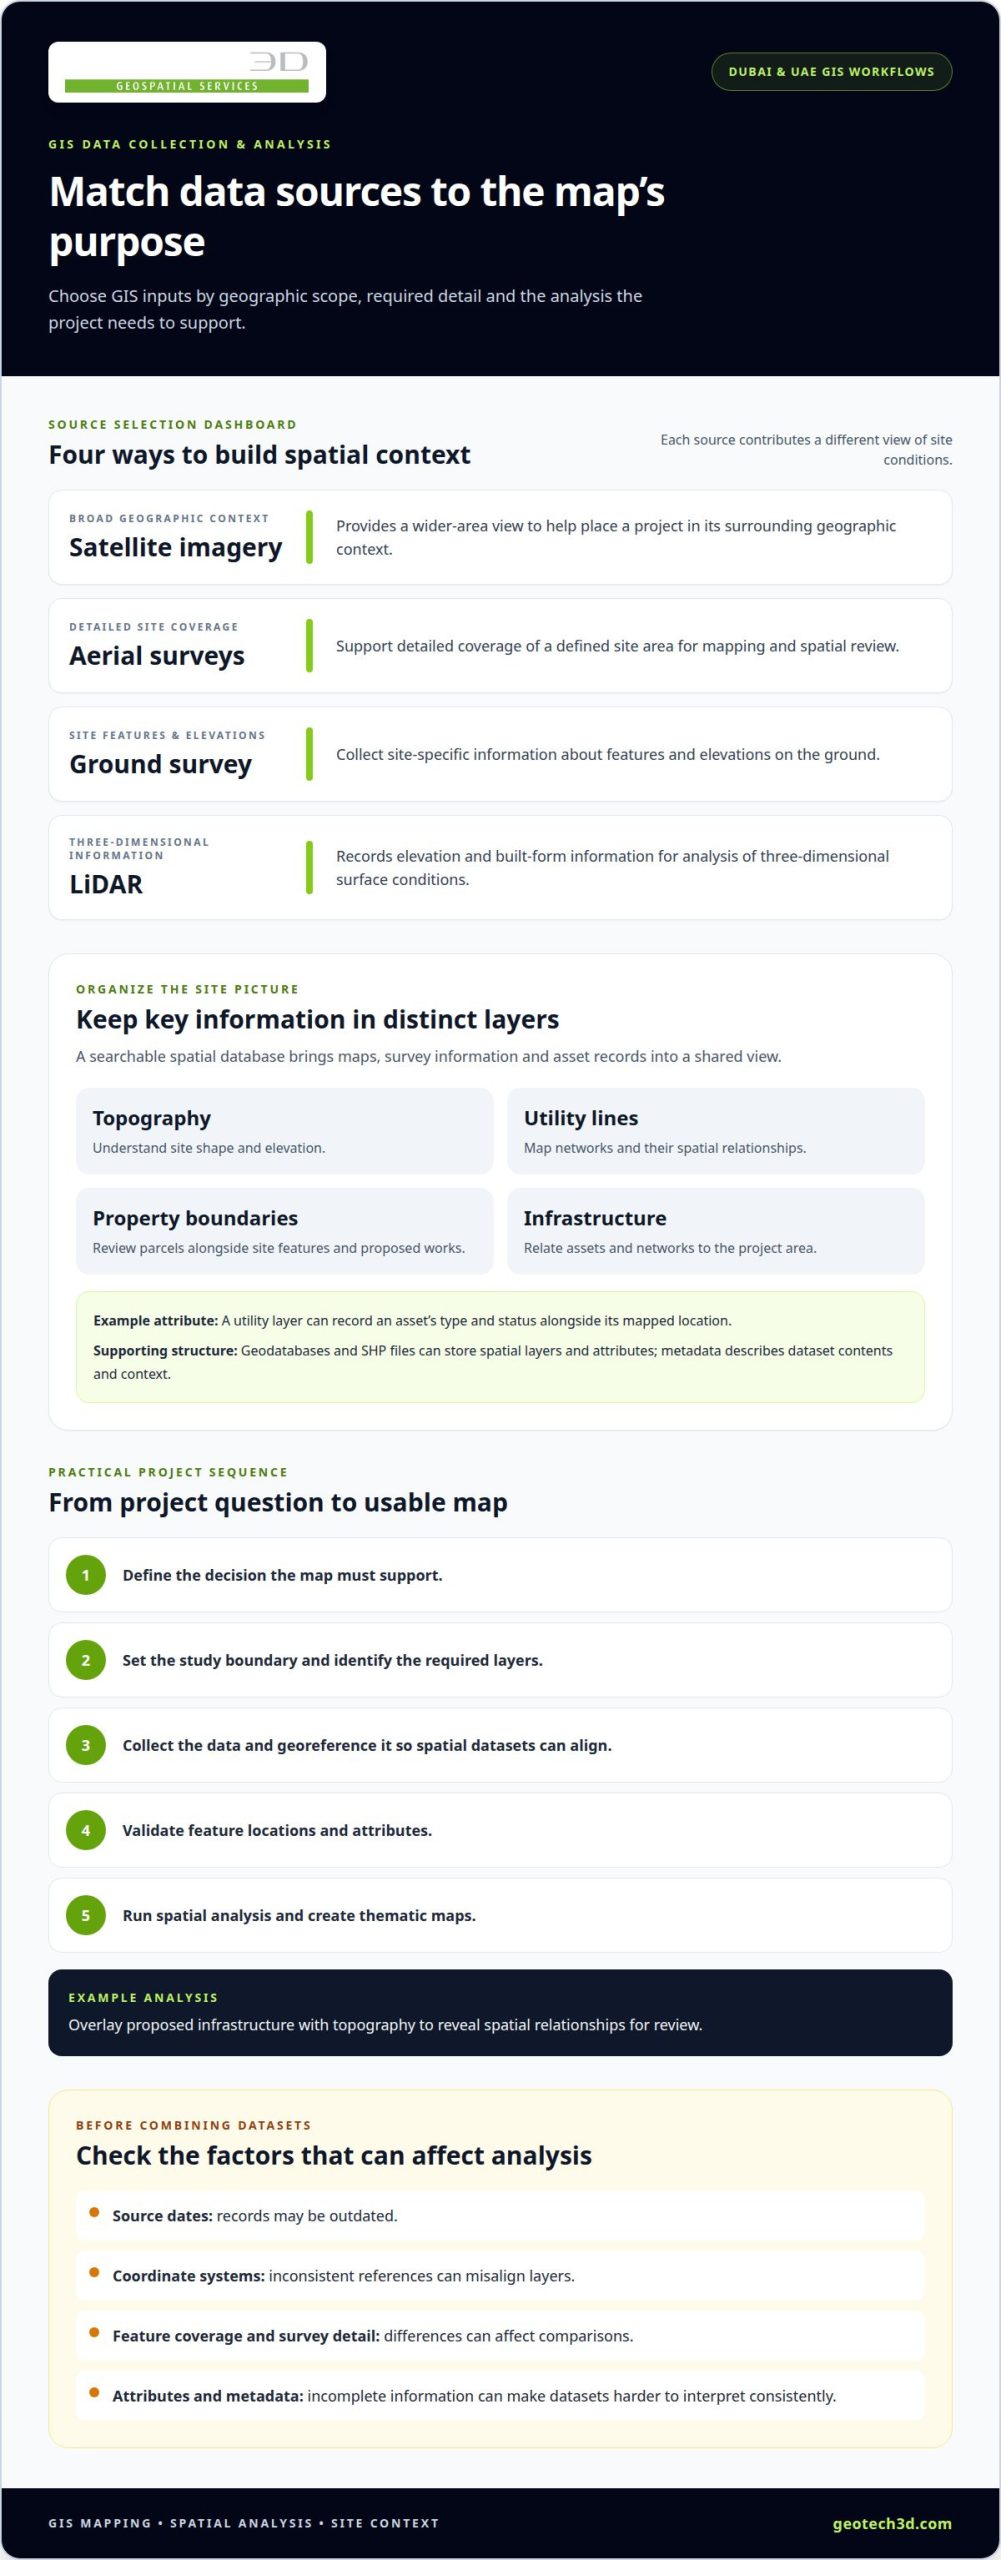
Dubai project inputs can include satellite imagery, aerial surveys and LiDAR, alongside ground survey data and asset records. Satellite imagery provides broad geographic context, aerial capture supports detailed site coverage, and LiDAR records elevation and built-form information. Choose sources according to the area, required detail and analysis purpose.
Collection methods include ground surveying for site features and elevations, drone surveys for aerial coverage, satellite imagery for wider-area context, and LiDAR for three-dimensional surface information. GIS tools such as QGIS and ArcGIS support layer management, spatial queries and map production. The right workflow depends on the data and intended output.
A practical project sequence is to define the decision the map must support, set the study boundary, identify required layers, collect and georeference the data, then validate attributes and locations. Next, run spatial analysis and create thematic maps. For example, overlaying proposed infrastructure with topography can reveal spatial relationships for review.
Common accuracy risks include outdated records, inconsistent coordinate references, incomplete attributes and differences in survey detail. These issues can misalign layers or affect analysis. Before combining datasets or drawing conclusions, check source dates, coordinate systems, feature coverage and metadata.
What types of projects can benefit from GIS mapping services?
GIS mapping is useful when a project depends on location, connectivity or relationships between assets. In Dubai, developers can use geographic information to assess site constraints, coordinate infrastructure planning and present complex spatial data in a format teams can interpret.
Utility network mapping is one practical example. Separate layers can represent existing and proposed water, electricity, sewage and telecom networks. Overlaying them with property boundaries or proposed works helps teams identify intersecting routes and areas that need closer review. A survey can add site-specific information to the records used for planning.
- Utility and infrastructure projects: Map network routes, access points and proposed works to support coordination across infrastructure layers.
- Development and construction: Compare parcels, site features and planned structures to examine spatial relationships before decisions are made.
- Property and asset management: Link mapped locations with asset records, making it easier to find and review information about a particular site or feature.
- Environmental planning: Use geographic layers to examine environmental conditions. The UAE Environmental Geospatial platform supports environment-related strategies and the Sustainable Development Goals.
GIS mapping also turns analysis into a visual output. A thematic map can use distinct symbols or colours to show categories such as network type or asset status. A spatial query can select features within a project boundary or identify where datasets overlap. These views help teams focus on relevant geographic information instead of searching through unrelated records.
Software supports different parts of the workflow. QGIS can manage spatial layers, inspect attributes and create maps. ArcGIS supports geographic data visualisation and spatial analysis. Choose software based on the required data, analysis and sharing format, not its name alone.
For geospatial information in the UAE, plan privacy and sharing controls around the data’s sensitivity. Limit access to authorised project participants, avoid including personal identifiers unless needed, and agree on permitted uses and sharing methods with the data owner before distribution.
For a project that needs mapped site or infrastructure information, discuss a project mapping workflow suited to its geographic scope and intended decisions.
Projects centred on environmental change, public information and geospatial data access can also benefit from mapping. The Dubai AI-powered vegetation-monitoring project was conducted as a single assessment, illustrating a focused use of spatial information for vegetation monitoring. The UAE Union Atlas includes interactive maps, international performance indicators, geographical statistics, satellite images and visual media. The UAE Union Atlas presents the country’s journey from 1971 to 2021. Together, these examples show how mapped information can support both a defined assessment and a broader presentation of geographic and statistical material, depending on the project’s purpose.
Public-sector data initiatives are another relevant project type. Abu Dhabi’s Spatial Data Infrastructure Program aims to promote geospatial innovation and make use of public-private partnerships. Abu Dhabi’s Spatial Data Infrastructure Program aims to regulate and facilitate the availability of high-quality geospatial data. These aims are relevant where projects need reliable geospatial information and collaboration around its availability. Mapping can also support work connected with aviation technology: GE Aerospace’s Middle East Aviation Technology Center in Dubai was launched on November 9, 2015. For any of these project types, the useful mapping workflow depends on the information required and the decisions it needs to support. Clear data arrangements and suitable visual outputs can help participants work with geographic information in a consistent way.
3D GIS and geographic imaging
A geographic information system can represent a site in three dimensions by combining geographic coordinates with elevation or height. This adds vertical context to a map: engineers can examine terrain, building forms and infrastructure together rather than relying only on a flat plan. For example, a 3D view can help interpret how a proposed structure relates to ground levels and nearby features.
Useful inputs depend on the question being analysed. LiDAR point clouds capture dense surface measurements, aerial imagery provides visual coverage, satellite imagery gives broader geographic context, and a digital elevation model represents ground height. Combining these sources lets GIS display terrain and built features as distinct datasets while preserving their geographic positions and attributes.
Three-dimensional data supports practical planning and asset review. A terrain model can reveal slope patterns across a development area, while building models can show massing in relation to surrounding structures. Utility or infrastructure layers can be viewed alongside elevation data to help teams understand spatial relationships. Retain each dataset’s source and coordinate reference so users can interpret how it fits the model.
Dubai’s AI image-processing pipeline supports super-resolution modeling at 4 x. This describes the pipeline’s image-processing capability, not a guaranteed improvement in every input or output. For a geographic imaging workflow, image resolution should be considered alongside source coverage, capture conditions and the intended use. More image detail does not, by itself, establish positional accuracy or replace survey control.
Several tools support distinct stages of a 3D GIS workflow:
- ArcGIS Pro: Organises geographic layers and supports 3D scene visualisation and spatial analysis.
- QGIS: Manages spatial datasets and creates map views, including three-dimensional scenes through supported components.
- CloudCompare: Inspects and compares point clouds, helping users review captured surface geometry.
- CesiumJS: Displays geospatial scenes in a web environment, including terrain and three-dimensional features.
For useful results, define the decision first, then choose the data and view. A terrain assessment needs elevation information; a visual context review may prioritise imagery; and a point-cloud inspection requires tools suited to dense measurements. Keep source layers identifiable rather than blending them into one opaque model. This lets teams distinguish observed data from derived surfaces and interpret the geographic information in context.
GIS data structuring and georeferencing
A reliable GIS platform needs consistent locations and a structure people can interpret. Georeferencing connects features or image pixels to real-world coordinates. For a Dubai site plan, align mapped boundaries with the project’s chosen coordinate reference system before comparing them with survey or infrastructure data.
Start by defining the dataset’s purpose and organising features by type. A site database might separate building footprints, access routes, utilities and survey control points into distinct layers. Each feature can include attributes such as asset category, source, collection date and status. Consistent field names and value formats make filtering and analysis more dependable.
Coordinate reference systems describe how locations on Earth are represented on a map. Datasets can appear offset if they use different systems or if one has been assigned the wrong reference. Reprojection transforms coordinates into a compatible system; changing a label alone does not transform the locations. Record the reference system with each dataset.
Georeferencing an image or legacy drawing involves linking identifiable points to known coordinates, then assessing how well the transformed image aligns. For example, a survey control point visible on a drawing can help anchor it to the project map. Check alignment against other reliable features, such as surveyed boundaries, before using the result for spatial measurements.
These tools support common structuring and alignment tasks:
- QGIS: Organises layers, edits attributes and supports coordinate transformations.
- ArcGIS Pro: Manages geospatial datasets and provides tools for georeferencing and spatial review.
- GDAL: Converts and processes raster and vector data, including coordinate transformations.
Structure also means choosing suitable geometry. Points represent individual assets or control locations, lines represent routes, and polygons represent parcels or work areas. Raster datasets suit continuous surfaces, such as elevation imagery. Keeping these forms separate helps distinguish a measured feature from a mapped area.
Before analysis, inspect the dataset’s geometry, attributes and metadata. Look for missing locations, duplicate features, inconsistent category values and gaps along shared boundaries. A utility line should connect logically across segments, and a parcel polygon should close correctly. These checks can reveal structural issues that affect overlays and queries.
Document each layer’s source, coordinate reference, collection method and limitations. This helps other GIS users understand how the dataset was prepared and whether it suits a particular task. For example, a georeferenced planning drawing can provide visual context, while precise boundary decisions require appropriate survey information. Clear structure keeps these uses distinct.
GIS deliverables and file formats
A GIS handover should make its contents usable in the recipient’s software and project workflow. Deliverables may include a geodatabase, SHP files, structured spatial layers with attributes, thematic maps, web GIS-ready datasets, CAD-to-GIS conversions, analysis reports and metadata. Select each item according to how project teams will review, analyse or share the information.
For Dubai projects, identify the coordinate reference system used by the source survey and the receiving platform. Keep that information with the dataset and ensure converted layers retain their intended geographic position. Follow the project’s agreed conventions for map presentation, including layer names, symbols, units and attribute definitions. These details help users interpret the same map consistently.
Vector formats suit discrete features. A SHP file can carry mapped features and associated attributes, while a geodatabase can organise related spatial datasets. For example, a utility network package might separate water, electricity and telecom layers, with fields identifying each feature’s category or status. Clear naming makes layers easier to find and use.
Raster data represents information as cells, making it suitable for imagery and continuous surfaces such as elevation. A GeoTIFF can store a georeferenced raster, while a JPEG may provide visual context without carrying the same spatial information. Confirm that raster files include the spatial reference and supporting information the recipient’s GIS software needs.
Deliverables serve different project tasks:
- Geodatabase: Groups related spatial layers and attributes for structured GIS management.
- SHP files: Share vector features and their attribute data across compatible GIS workflows.
- Web GIS-ready datasets: Prepare spatial content for use in web mapping platforms.
- Thematic maps: Present categories or analysis results, such as asset types or site constraints.
- CAD-to-GIS conversions: Bring design geometry into a spatial workflow while preserving useful feature distinctions.
- Metadata and analysis reports: Explain data sources, structure and analytical results for later review.
Tools help prepare and inspect these outputs. QGIS and ArcGIS Pro support layer management, map production and common GIS export workflows. GDAL can convert and process raster and vector datasets. Before handover, review coordinate references, field names, attribute values, layer visibility and file integrity. For example, a utility layer should remain identifiable after conversion, not become an unexplained collection of lines.
Specify the intended recipient, software platform, required layers and analysis purpose before packaging files. These choices guide format selection and help prevent a map that opens correctly but lacks essential attributes or context.
GEOTECH 3D
GEOTECH 3D supports project teams that need site information collected and organised for spatial decision-making. Its GIS & Surveying Services can help connect mapped features with project requirements, while a topo survey can provide site-level information for planning and analysis.
Where project context calls for additional capture, Drone Services and 3D Laser Scanning can contribute aerial or three-dimensional data. These inputs can support a GIS workflow when teams need to interpret site conditions alongside mapped assets and infrastructure. The appropriate approach depends on the project area, required information and intended use of the data.
For GIS data collection and analysis in Dubai, contact GEOTECH 3D to discuss your project requirements and mapping needs.
Turn spatial information into your next project decision
Make the next step a clear project decision. Define what the team needs to understand, which geographic information can answer the question, and how the resulting data will be used. A focused scope keeps collection, analysis and deliverables aligned with practical planning requirements.
For GIS data collection and analysis in Dubai, the right source depends on the site and intended use. GEOTECH 3D offers topo survey, 3D Laser Scanning and Drone Services, which can support project data acquisition in different contexts. Bringing those inputs into a considered GIS workflow helps teams assess how spatial information can serve their objectives.
To prepare, identify the project area, the decisions the mapping must support and the formats your team needs. These details provide a useful starting brief for a GIS discussion.
Clear project questions build a stronger foundation for informed decisions across Dubai and the UAE.
Frequently Asked Questions
How does GIS mapping streamline decision-making?
GIS mapping helps decision-makers assess where an action may have the greatest effect. For example, a project manager can compare work areas with access routes when planning construction phases. A shared map gives team members a common visual reference for coordination, helping them discuss the same locations and identify questions to resolve before plans advance.
What are GIS services?
GIS services prepare and use location-based information for a defined project purpose. The scope may focus on organising existing geographic records, producing a decision-focused map or analysing a specific planning question. Clear objectives help determine the work required and how the resulting information should support project reviews and coordination.
What is GIS mapping?
GIS mapping associates information with geographic locations so users can explore it by place. Unlike a static plan, a GIS map can support queries, such as locating features within a defined project area. This helps users examine where an issue occurs and focus follow-up on the relevant location.
What kind of data can be incorporated into GIS maps?
Data can be included when it has a geographic location or can be reliably linked to a mapped feature. For instance, inspection observations can be associated with a building identifier, while planning records can be connected to a parcel reference. Useful attributes depend on the decision at hand. Consistent identifiers help users connect map features with relevant project records.
What GIS data collection services are available in Dubai?
GEOTECH 3D offers GIS & Surveying Services. A suitable project scope starts by identifying the area of interest, the information needed and the decisions the data must support. This clarifies whether the work should focus on assembling existing records, collecting site information or preparing spatial analysis. A defined scope also helps align outputs with the project team’s intended use.
Which GIS software and mapping platforms are commonly used in Dubai?
QGIS and ArcGIS Pro are examples of software used for GIS tasks; this does not establish their prevalence in Dubai. Platform selection depends on the project workflow, the receiving team’s capabilities and the required outputs. Before a handover, align the software environment and export requirements so the intended users can open, interpret and work with the data.
Better project decisions start with data that can be viewed together. GIS data collection and analysis in Dubai brings maps, survey information and asset records into a searchable format for visualisation and spatial analysis. By organising topography, utility lines, property boundaries and infrastructure as separate layers, GIS helps teams understand site conditions and how features relate.
For developers, contractors and consultants, this shared context matters. When information is scattered across separate records, it can be harder to assess constraints and coordinate planning. A well-structured GIS dataset gives project teams a practical way to explore spatial relationships and communicate findings.
This article explains how GIS mapping supports decision-making, which types of projects can benefit and how georeferencing, 3D data and file formats fit into a GIS workflow. It also outlines the role of data collection and analysis in turning site information into usable mapping outputs for projects across Dubai and the UAE.
Key Takeaways
- Combine survey data, maps and asset records to make site conditions easier to interpret and analyse.
- Use utility network mapping to view existing and proposed services in their spatial context.
- Bring 3D information into GIS when project decisions depend on understanding vertical as well as surface conditions.
- Georeferencing helps spatial datasets align, while clear data structures support reliable use across project workflows.
- Choose GIS deliverables and file formats around how teams will use, share and analyse the information.
Importance of accurate site data for Dubai developers
For GIS data collection and analysis in Dubai, accurate site data helps developers connect physical conditions with project records. A spatial database can bring survey information, asset records and maps into a searchable view. Topography, utility lines, property boundaries and infrastructure become separate layers, making relationships across a site easier to assess.
GIS database development starts by defining the project area, required features and attribute fields. A utility layer, for example, can record an asset’s type and status alongside its mapped location. Geodatabases and SHP files can store structured spatial layers and attributes, while metadata describes the dataset’s contents and context. Together, these elements help teams manage updates and interpret information consistently.
Drone survey permissions depend on the flight activity and location, while ground-based data collection depends on site access. Include an approvals review in the project plan before choosing a collection method. Do not assume one permission covers every site or activity.
For government and open data, Bayanat, the UAE national data portal, publishes geospatial and GIS datasets. The UAE’s 1Map initiative provides access to statistics and survey outputs through geospatial dashboards. Abu Dhabi’s Spatial Data Infrastructure Program focuses on sharing geospatial data among government agencies and stakeholders; it aims to advance the emirate towards SDI 3.0. These are national and Abu Dhabi resources, not a list of Dubai departments.
Dubai project inputs can include satellite imagery, aerial surveys and LiDAR, alongside ground survey data and asset records. Satellite imagery provides broad geographic context, aerial capture supports detailed site coverage, and LiDAR records elevation and built-form information. Choose sources according to the area, required detail and analysis purpose.
Collection methods include ground surveying for site features and elevations, drone surveys for aerial coverage, satellite imagery for wider-area context, and LiDAR for three-dimensional surface information. GIS tools such as QGIS and ArcGIS support layer management, spatial queries and map production. The right workflow depends on the data and intended output.
A practical project sequence is to define the decision the map must support, set the study boundary, identify required layers, collect and georeference the data, then validate attributes and locations. Next, run spatial analysis and create thematic maps. For example, overlaying proposed infrastructure with topography can reveal spatial relationships for review.
Common accuracy risks include outdated records, inconsistent coordinate references, incomplete attributes and differences in survey detail. These issues can misalign layers or affect analysis. Before combining datasets or drawing conclusions, check source dates, coordinate systems, feature coverage and metadata.
What types of projects can benefit from GIS mapping services?
GIS mapping is useful when a project depends on location, connectivity or relationships between assets. In Dubai, developers can use geographic information to assess site constraints, coordinate infrastructure planning and present complex spatial data in a format teams can interpret.
Utility network mapping is one practical example. Separate layers can represent existing and proposed water, electricity, sewage and telecom networks. Overlaying them with property boundaries or proposed works helps teams identify intersecting routes and areas that need closer review. A survey can add site-specific information to the records used for planning.
- Utility and infrastructure projects: Map network routes, access points and proposed works to support coordination across infrastructure layers.
- Development and construction: Compare parcels, site features and planned structures to examine spatial relationships before decisions are made.
- Property and asset management: Link mapped locations with asset records, making it easier to find and review information about a particular site or feature.
- Environmental planning: Use geographic layers to examine environmental conditions. The UAE Environmental Geospatial platform supports environment-related strategies and the Sustainable Development Goals.
GIS mapping also turns analysis into a visual output. A thematic map can use distinct symbols or colours to show categories such as network type or asset status. A spatial query can select features within a project boundary or identify where datasets overlap. These views help teams focus on relevant geographic information instead of searching through unrelated records.
Software supports different parts of the workflow. QGIS can manage spatial layers, inspect attributes and create maps. ArcGIS supports geographic data visualisation and spatial analysis. Choose software based on the required data, analysis and sharing format, not its name alone.
For geospatial information in the UAE, plan privacy and sharing controls around the data’s sensitivity. Limit access to authorised project participants, avoid including personal identifiers unless needed, and agree on permitted uses and sharing methods with the data owner before distribution.
For a project that needs mapped site or infrastructure information, discuss a project mapping workflow suited to its geographic scope and intended decisions.
Projects centred on environmental change, public information and geospatial data access can also benefit from mapping. The Dubai AI-powered vegetation-monitoring project was conducted as a single assessment, illustrating a focused use of spatial information for vegetation monitoring. The UAE Union Atlas includes interactive maps, international performance indicators, geographical statistics, satellite images and visual media. The UAE Union Atlas presents the country’s journey from 1971 to 2021. Together, these examples show how mapped information can support both a defined assessment and a broader presentation of geographic and statistical material, depending on the project’s purpose.
Public-sector data initiatives are another relevant project type. Abu Dhabi’s Spatial Data Infrastructure Program aims to promote geospatial innovation and make use of public-private partnerships. Abu Dhabi’s Spatial Data Infrastructure Program aims to regulate and facilitate the availability of high-quality geospatial data. These aims are relevant where projects need reliable geospatial information and collaboration around its availability. Mapping can also support work connected with aviation technology: GE Aerospace’s Middle East Aviation Technology Center in Dubai was launched on November 9, 2015. For any of these project types, the useful mapping workflow depends on the information required and the decisions it needs to support. Clear data arrangements and suitable visual outputs can help participants work with geographic information in a consistent way.
3D GIS and geographic imaging
A geographic information system can represent a site in three dimensions by combining geographic coordinates with elevation or height. This adds vertical context to a map: engineers can examine terrain, building forms and infrastructure together rather than relying only on a flat plan. For example, a 3D view can help interpret how a proposed structure relates to ground levels and nearby features.
Useful inputs depend on the question being analysed. LiDAR point clouds capture dense surface measurements, aerial imagery provides visual coverage, satellite imagery gives broader geographic context, and a digital elevation model represents ground height. Combining these sources lets GIS display terrain and built features as distinct datasets while preserving their geographic positions and attributes.
Three-dimensional data supports practical planning and asset review. A terrain model can reveal slope patterns across a development area, while building models can show massing in relation to surrounding structures. Utility or infrastructure layers can be viewed alongside elevation data to help teams understand spatial relationships. Retain each dataset’s source and coordinate reference so users can interpret how it fits the model.
Dubai’s AI image-processing pipeline supports super-resolution modeling at 4 x. This describes the pipeline’s image-processing capability, not a guaranteed improvement in every input or output. For a geographic imaging workflow, image resolution should be considered alongside source coverage, capture conditions and the intended use. More image detail does not, by itself, establish positional accuracy or replace survey control.
Several tools support distinct stages of a 3D GIS workflow:
- ArcGIS Pro: Organises geographic layers and supports 3D scene visualisation and spatial analysis.
- QGIS: Manages spatial datasets and creates map views, including three-dimensional scenes through supported components.
- CloudCompare: Inspects and compares point clouds, helping users review captured surface geometry.
- CesiumJS: Displays geospatial scenes in a web environment, including terrain and three-dimensional features.
For useful results, define the decision first, then choose the data and view. A terrain assessment needs elevation information; a visual context review may prioritise imagery; and a point-cloud inspection requires tools suited to dense measurements. Keep source layers identifiable rather than blending them into one opaque model. This lets teams distinguish observed data from derived surfaces and interpret the geographic information in context.
GIS data structuring and georeferencing
A reliable GIS platform needs consistent locations and a structure people can interpret. Georeferencing connects features or image pixels to real-world coordinates. For a Dubai site plan, align mapped boundaries with the project’s chosen coordinate reference system before comparing them with survey or infrastructure data.
Start by defining the dataset’s purpose and organising features by type. A site database might separate building footprints, access routes, utilities and survey control points into distinct layers. Each feature can include attributes such as asset category, source, collection date and status. Consistent field names and value formats make filtering and analysis more dependable.
Coordinate reference systems describe how locations on Earth are represented on a map. Datasets can appear offset if they use different systems or if one has been assigned the wrong reference. Reprojection transforms coordinates into a compatible system; changing a label alone does not transform the locations. Record the reference system with each dataset.
Georeferencing an image or legacy drawing involves linking identifiable points to known coordinates, then assessing how well the transformed image aligns. For example, a survey control point visible on a drawing can help anchor it to the project map. Check alignment against other reliable features, such as surveyed boundaries, before using the result for spatial measurements.
These tools support common structuring and alignment tasks:
- QGIS: Organises layers, edits attributes and supports coordinate transformations.
- ArcGIS Pro: Manages geospatial datasets and provides tools for georeferencing and spatial review.
- GDAL: Converts and processes raster and vector data, including coordinate transformations.
Structure also means choosing suitable geometry. Points represent individual assets or control locations, lines represent routes, and polygons represent parcels or work areas. Raster datasets suit continuous surfaces, such as elevation imagery. Keeping these forms separate helps distinguish a measured feature from a mapped area.
Before analysis, inspect the dataset’s geometry, attributes and metadata. Look for missing locations, duplicate features, inconsistent category values and gaps along shared boundaries. A utility line should connect logically across segments, and a parcel polygon should close correctly. These checks can reveal structural issues that affect overlays and queries.
Document each layer’s source, coordinate reference, collection method and limitations. This helps other GIS users understand how the dataset was prepared and whether it suits a particular task. For example, a georeferenced planning drawing can provide visual context, while precise boundary decisions require appropriate survey information. Clear structure keeps these uses distinct.
GIS deliverables and file formats
A GIS handover should make its contents usable in the recipient’s software and project workflow. Deliverables may include a geodatabase, SHP files, structured spatial layers with attributes, thematic maps, web GIS-ready datasets, CAD-to-GIS conversions, analysis reports and metadata. Select each item according to how project teams will review, analyse or share the information.
For Dubai projects, identify the coordinate reference system used by the source survey and the receiving platform. Keep that information with the dataset and ensure converted layers retain their intended geographic position. Follow the project’s agreed conventions for map presentation, including layer names, symbols, units and attribute definitions. These details help users interpret the same map consistently.
Vector formats suit discrete features. A SHP file can carry mapped features and associated attributes, while a geodatabase can organise related spatial datasets. For example, a utility network package might separate water, electricity and telecom layers, with fields identifying each feature’s category or status. Clear naming makes layers easier to find and use.
Raster data represents information as cells, making it suitable for imagery and continuous surfaces such as elevation. A GeoTIFF can store a georeferenced raster, while a JPEG may provide visual context without carrying the same spatial information. Confirm that raster files include the spatial reference and supporting information the recipient’s GIS software needs.
Deliverables serve different project tasks:
- Geodatabase: Groups related spatial layers and attributes for structured GIS management.
- SHP files: Share vector features and their attribute data across compatible GIS workflows.
- Web GIS-ready datasets: Prepare spatial content for use in web mapping platforms.
- Thematic maps: Present categories or analysis results, such as asset types or site constraints.
- CAD-to-GIS conversions: Bring design geometry into a spatial workflow while preserving useful feature distinctions.
- Metadata and analysis reports: Explain data sources, structure and analytical results for later review.
Tools help prepare and inspect these outputs. QGIS and ArcGIS Pro support layer management, map production and common GIS export workflows. GDAL can convert and process raster and vector datasets. Before handover, review coordinate references, field names, attribute values, layer visibility and file integrity. For example, a utility layer should remain identifiable after conversion, not become an unexplained collection of lines.
Specify the intended recipient, software platform, required layers and analysis purpose before packaging files. These choices guide format selection and help prevent a map that opens correctly but lacks essential attributes or context.
GEOTECH 3D
GEOTECH 3D supports project teams that need site information collected and organised for spatial decision-making. Its GIS & Surveying Services can help connect mapped features with project requirements, while a topo survey can provide site-level information for planning and analysis.
Where project context calls for additional capture, Drone Services and 3D Laser Scanning can contribute aerial or three-dimensional data. These inputs can support a GIS workflow when teams need to interpret site conditions alongside mapped assets and infrastructure. The appropriate approach depends on the project area, required information and intended use of the data.
For GIS data collection and analysis in Dubai, contact GEOTECH 3D to discuss your project requirements and mapping needs.
Turn spatial information into your next project decision
Make the next step a clear project decision. Define what the team needs to understand, which geographic information can answer the question, and how the resulting data will be used. A focused scope keeps collection, analysis and deliverables aligned with practical planning requirements.
For GIS data collection and analysis in Dubai, the right source depends on the site and intended use. GEOTECH 3D offers topo survey, 3D Laser Scanning and Drone Services, which can support project data acquisition in different contexts. Bringing those inputs into a considered GIS workflow helps teams assess how spatial information can serve their objectives.
To prepare, identify the project area, the decisions the mapping must support and the formats your team needs. These details provide a useful starting brief for a GIS discussion.
Clear project questions build a stronger foundation for informed decisions across Dubai and the UAE.
Frequently Asked Questions
How does GIS mapping streamline decision-making?
GIS mapping helps decision-makers assess where an action may have the greatest effect. For example, a project manager can compare work areas with access routes when planning construction phases. A shared map gives team members a common visual reference for coordination, helping them discuss the same locations and identify questions to resolve before plans advance.
What are GIS services?
GIS services prepare and use location-based information for a defined project purpose. The scope may focus on organising existing geographic records, producing a decision-focused map or analysing a specific planning question. Clear objectives help determine the work required and how the resulting information should support project reviews and coordination.
What is GIS mapping?
GIS mapping associates information with geographic locations so users can explore it by place. Unlike a static plan, a GIS map can support queries, such as locating features within a defined project area. This helps users examine where an issue occurs and focus follow-up on the relevant location.
What kind of data can be incorporated into GIS maps?
Data can be included when it has a geographic location or can be reliably linked to a mapped feature. For instance, inspection observations can be associated with a building identifier, while planning records can be connected to a parcel reference. Useful attributes depend on the decision at hand. Consistent identifiers help users connect map features with relevant project records.
What GIS data collection services are available in Dubai?
GEOTECH 3D offers GIS & Surveying Services. A suitable project scope starts by identifying the area of interest, the information needed and the decisions the data must support. This clarifies whether the work should focus on assembling existing records, collecting site information or preparing spatial analysis. A defined scope also helps align outputs with the project team’s intended use.
Which GIS software and mapping platforms are commonly used in Dubai?
QGIS and ArcGIS Pro are examples of software used for GIS tasks; this does not establish their prevalence in Dubai. Platform selection depends on the project workflow, the receiving team’s capabilities and the required outputs. Before a handover, align the software environment and export requirements so the intended users can open, interpret and work with the data.
Search Now
Error: Contact form not found.