

Our Services
Thermal Drone Inspection in UAE: Dubai Guide
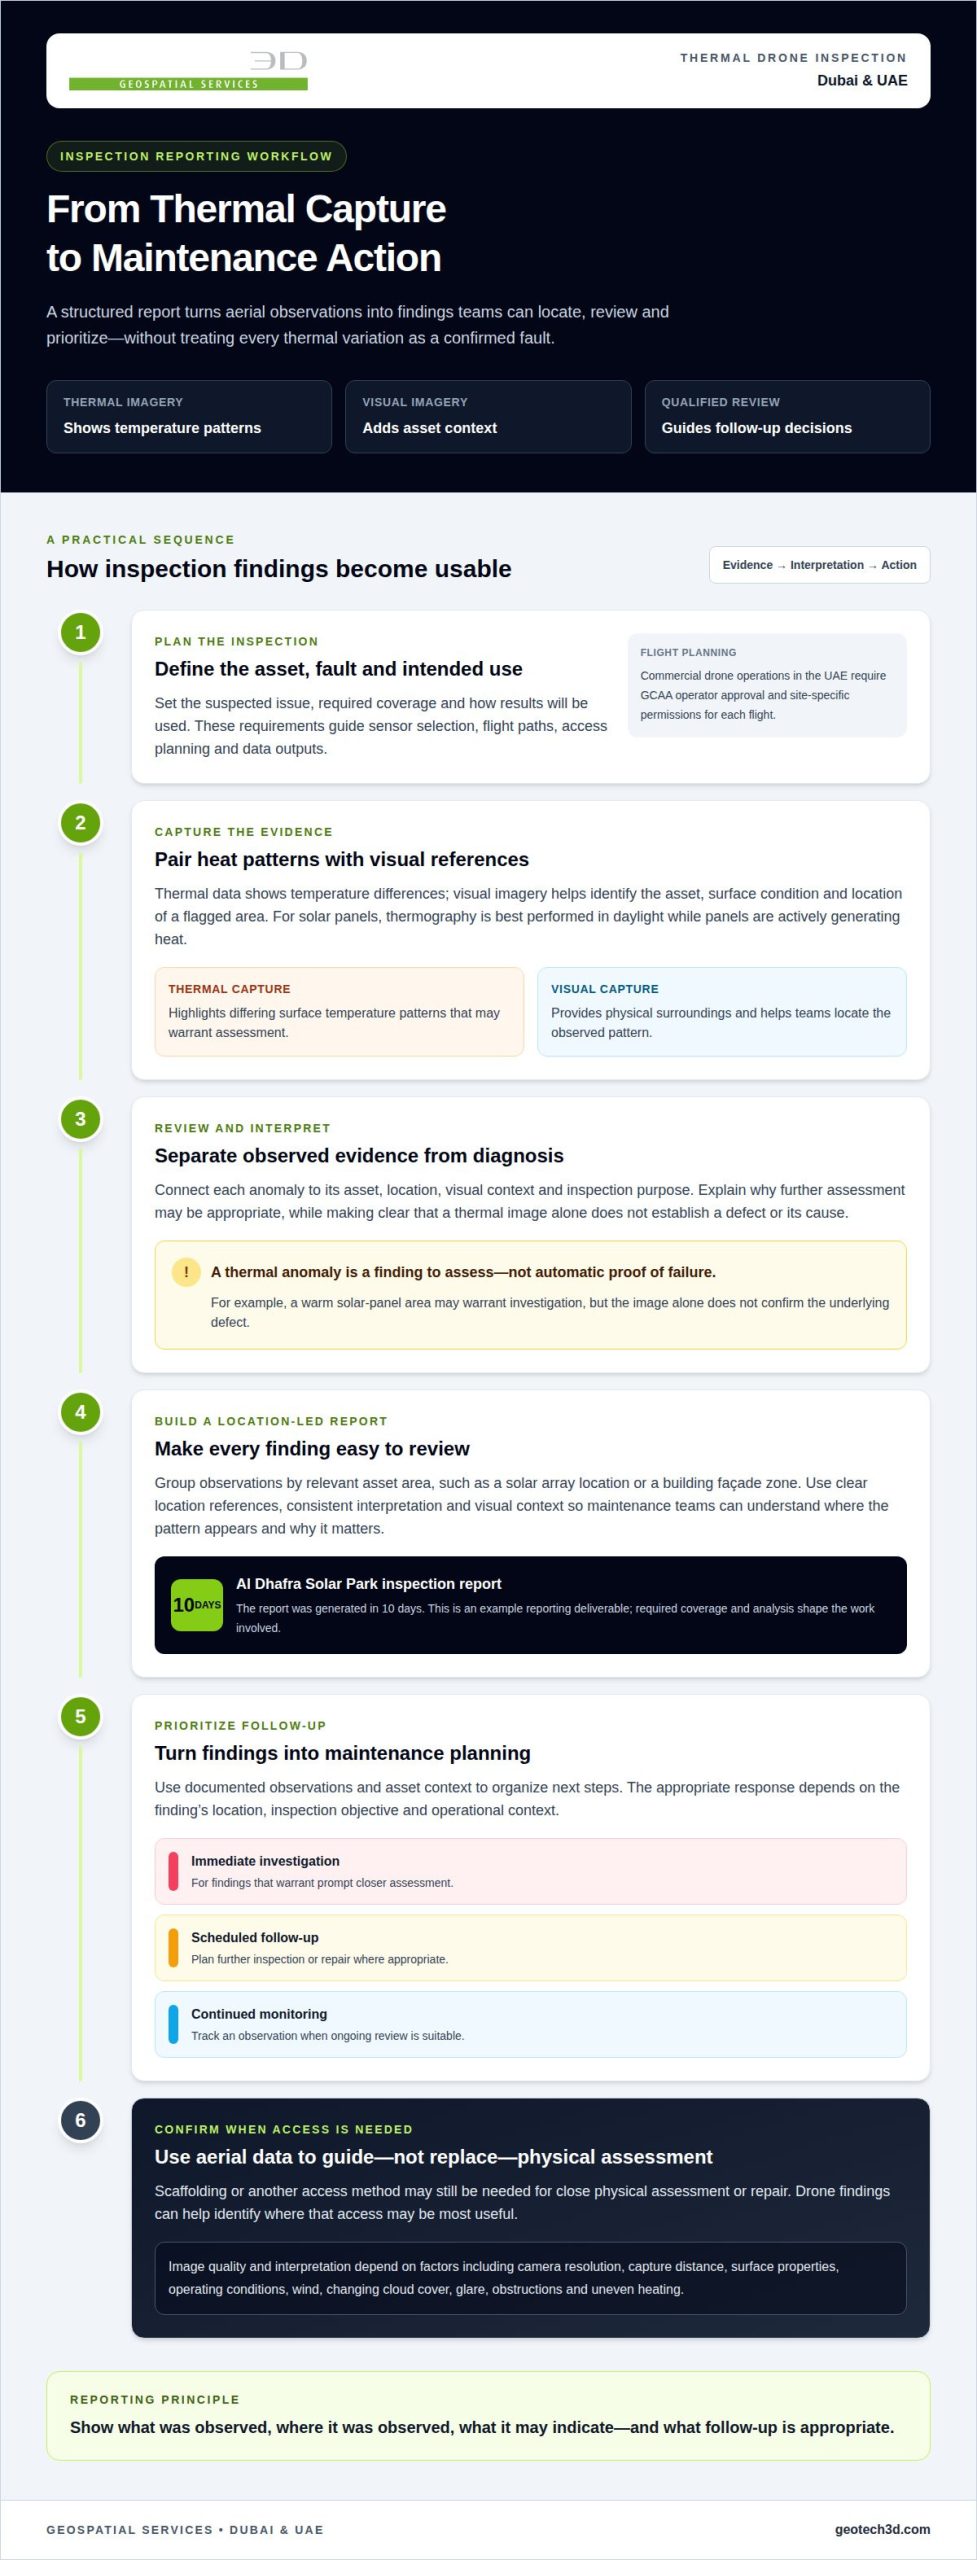
Thermal drone inspections can cover large or difficult-to-access assets faster than traditional methods, while keeping personnel on the ground. For thermal drone inspection in the UAE, aerial imaging can help identify heat anomalies without relying on access methods such as scaffolding or rope access. Traditional inspections may still be needed when the task requires close physical assessment or investigation beyond what surface imagery can show.
Inspection data is most useful when it is both comprehensive and practical to act on. A drone survey can capture more of an asset and, where needed, combine thermal imagery with other sensor data. This guide compares thermal and multi-sensor drone inspections with traditional methods, explains what affects coverage, and shows how structured reporting can support maintenance planning in Dubai and across the UAE.
Key Takeaways
- Understand where aerial thermal inspections can reduce access demands compared with traditional inspection methods.
- Learn how thermal findings can be organized into reports that support maintenance prioritization and follow-up.
- Explore the industrial and infrastructure assets that can benefit from UAV-based inspection coverage.
- See how combining thermal imaging with other sensors can provide broader context for asset assessment.
- Identify when GEOTECH 3D’s Drone Services and related surveying capabilities can support inspection planning in Dubai and the UAE.
How does drone-based thermal inspection compare to traditional methods?
Drone-based thermal inspections can survey broad or elevated assets without placing personnel at every inspection point. Traditional methods may require scaffolding, shutdowns, or rope access, adding access planning and exposing teams to operational hazards. Thermal drone inspection in the UAE can combine aerial heat imaging with visual capture to help identify areas for closer assessment.
Thermal imaging records temperature patterns across visible surfaces. On a building façade, an unusual pattern may indicate possible heat loss, insulation failure, moisture intrusion, or another thermal anomaly. It highlights an area for investigation, but does not prove the cause of a leak or confirm a concealed defect. Engineers interpret the pattern alongside building details and site conditions.
For solar panels, thermal images can reveal uneven heating that warrants follow-up. Useful capture conditions depend on the inspection objective. Solar-panel thermography is best performed during daylight, while panels are actively generating heat. Visual images add context, such as panel layout, surface damage, or the location of a flagged area. Together, thermal and visual data help teams distinguish an anomaly from its physical surroundings.
Thermal cameras identify heat differences, while LiDAR records three-dimensional spatial information. When the task requires both, these sensors can relate a thermal finding to an asset’s geometry. Thermal images show surface temperature patterns, so they may not reveal all conditions within a wall. In façade leakage investigations, it can identify surface temperature patterns for targeted inspection, but suitable conditions and follow-up methods are needed to determine whether water is present.
Commercial drone operations in the UAE require GCAA operator approval and site-specific permissions for each flight. Federal Decree-Law No. (26), issued on 26 September 2022, concerns regulation of the civil use of unmanned aircraft and related activities, according to the General Civil Aviation Authority (GCAA) of the UAE.
To arrange an inspection, define the asset, suspected fault, required coverage, and intended use of the results. The inspection team can plan sensor selection, flight paths, access, and data outputs around those requirements. A façade assessment focused on heat patterns, for example, differs from a solar survey that needs panel-level thermal and visual coverage.
Accuracy depends on camera resolution, capture distance, surface properties, operating conditions, and interpretation quality. Thermal imagery can identify patterns or anomalies on solar panels, buildings, and power lines, but does not establish the cause of every fault. Wind, changing cloud cover, glare, obstructions, and uneven heating can affect image quality. Teams also plan for nearby people, restricted access, privacy-sensitive areas, and secure handling of captured imagery.
Thermal inspection reporting and maintenance planning
A useful thermal report turns aerial observations into findings that maintenance teams can locate, review, and prioritize. In the UAE, reports can document detected thermal patterns and support planning for follow-up inspections or repairs.
Qualified Interpretation of Findings
Thermal images show temperature differences, not automatic diagnoses. Interpretation should connect each anomaly to its asset, location, visual context, and inspection purpose. A warm area on a solar panel, for example, may warrant investigation, but the image alone does not establish the underlying defect or its cause.
A clear report separates observed evidence from interpretation. It identifies where each finding appears, describes the pattern, and explains why further assessment may be appropriate. This helps maintenance teams avoid treating every thermal variation as a confirmed failure and gives engineers a practical basis for deciding which locations need closer examination.
Thermal Data and Performance Reports
Performance reporting organizes thermal observations so teams can compare locations and understand asset condition. For a solar installation, findings can be grouped by array area or panel location and linked to visual references. For a building, the report can identify façade zones with distinct thermal patterns. Clear location references and consistent interpretation are essential to the report’s value.
The Al Dhafra Solar Park inspection report was generated in 10 days. That example shows how a reporting deliverable can follow aerial data capture, while the project’s required coverage and analysis shape the work involved. A report should make its findings usable for maintenance planning, rather than presenting thermal images without enough context to act on them.
AI-assisted analysis tools can help detect and flag anomalies across large image sets. High-resolution visual and thermal data give reviewers additional context, but automated flags still need qualified interpretation. Assess a suspected defect against the asset’s location and inspection objective before turning it into a maintenance action. This helps teams distinguish review priorities from confirmed faults.
Teams can use report findings to organize work into immediate investigation, scheduled follow-up, and continued monitoring. A thermal anomaly near a critical component may warrant different attention from an isolated pattern with no operational context. Maintenance staff can connect each action to a location and documented observation, reducing ambiguity during handover.
Scaffolding or other access methods may still be needed for close physical assessment or repair. Drone inspection services can help identify where such access may be most useful, rather than treating aerial data as a substitute for every inspection task. A coordinated geospatial data workflow can help keep captured findings organized for subsequent review and planning.
UAV inspection of industrial and infrastructure assets
UAV inspections can capture visual and thermal information across industrial sites, utilities, and large infrastructure. Their usefulness depends on the asset, the inspection objective, and how teams will use the resulting data.
Inspections of Difficult-to-Reach Assets
For flare stacks and cooling towers, scaffolding in the UAE can take two to four weeks. A UAV can capture aerial views and help identify visible damage or thermal anomalies without placing inspectors at height during initial data collection. This can be useful when access is difficult or the location is hazardous.
Power lines, wind turbines, oil rigs, and industrial facilities each present different coverage challenges. Flight planning defines the areas to capture and the viewpoints needed for assessment. RTK-enabled UAV platforms support industrial asset inspections, while georeferenced imagery links observations to their locations. Reports can then direct attention to specific components for closer assessment.
Live Asset Inspections Without Shutdowns
UAV data capture can assess accessible exterior areas while an asset remains operational, where the flight plan and site conditions allow. For example, aerial inspection can document external conditions at a power station without making shutdown the default requirement for visual capture. A flight does not replace procedures required for work near energized equipment or other operational hazards.
At a 300 kW-level power station, aerial hot-spot detection is one example of using thermal data to identify areas for review. The inspection objective should define which equipment is visible, which thermal patterns matter, and how findings will be reported. Thermal imagery can flag anomalies, while qualified follow-up determines their operational significance.
Industrial UAV work can cover solar panels, wind turbines, oil rigs, power lines, and large infrastructure projects. For bridges and railways, georeferenced visual and thermal imagery can help locate potential faults down to the centimeter. This imagery supports targeted assessment, but does not measure wall thickness or reveal subsurface flaws.
Construction teams can coordinate aerial asset capture with construction surveys. A survey establishes site or structure context, while inspection imagery documents visible conditions at selected assets. Combining these datasets can help project teams relate observed conditions to mapped locations and construction records. Each dataset serves a distinct purpose, so survey measurements should not be treated as thermal findings.
For a multi-sensor inspection, the team defines coverage, sensor requirements, access constraints, and report outputs before planning the flight. LiDAR-supported surveys can add spatial context when needed. This approach makes findings easier to locate and review while keeping the inspection focused on the asset’s maintenance or construction question.
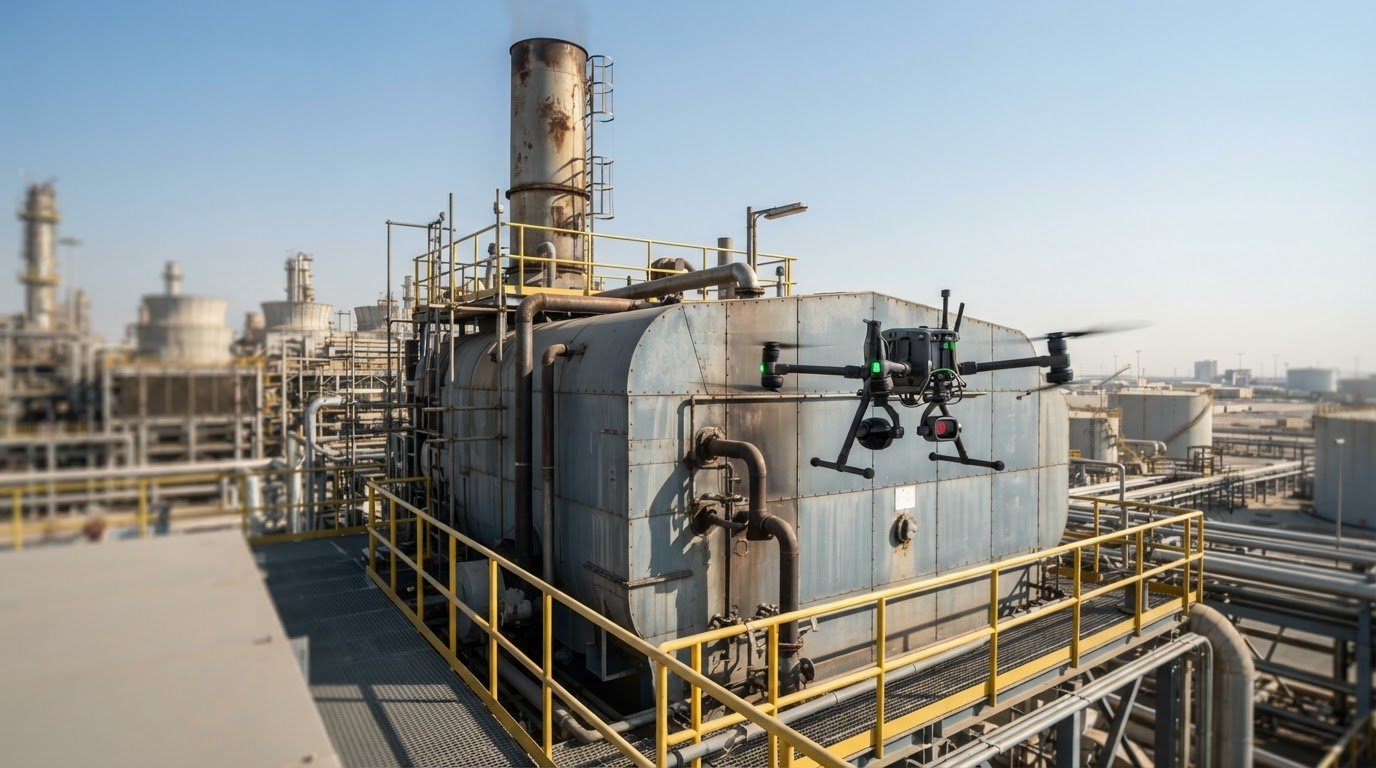
Inspection coverage of powerlines, flare stacks, chimneys, boilers, and tanks
Coverage planning starts by defining the asset, its visible components, and the inspection objective. For power lines, the flight plan can organize capture by route section, tower, and accessible equipment. Flare stacks and chimneys need viewpoints that document visible surfaces and attachments. Boilers and tanks require a scope suited to their shape, operating context, and accessible exterior areas.
At power plants and substations, teams can group coverage by equipment area, such as transformers, insulators, or external structures. Thermal imaging can help identify unusual heat patterns on visible components, while visual cameras record surrounding context. Linking observations to asset locations gives operations teams a clearer basis for assessing findings and deciding where further examination is useful.
Powerline inspections benefit from consistent records for each tower and span. Thermal or visual observations can be associated with a location and relevant component, allowing maintenance teams to review findings in route order. This supports prioritization without treating every captured variation as a confirmed defect. The inspection scope should reflect network maintenance objectives and the components visible during capture.
Flare stacks and chimneys can be documented from planned viewpoints around their accessible exterior surfaces. For boilers and tanks, the capture plan should account for obstructions and areas needing closer examination. Specialist drones can access storage tanks and other areas, reducing the need for inspectors to enter dangerous confined spaces. Aerial data can guide follow-up, but does not replace every close physical examination.
AI-powered analysis tools can help flag patterns in large sets of inspection images for review. Analysts can assess those flags alongside thermal imagery, visual context, and the asset’s location. For example, a flagged area on a substation component can be linked to its recorded image and equipment reference. Automated detection supports review, but does not independently establish a fault or its cause.
For infrastructure inspections in Dubai and across the UAE, reports should organize findings around identifiable assets and maintenance priorities. Teams can group powerline observations by tower and plant findings by unit or structure. This makes later review more coherent and supports comparison across inspection records. The capture plan should address the operational question, whether that means assessing a specific component or documenting broader asset condition.
Thermal and multi-sensor drone inspections
Thermal imaging is most useful when its findings can be interpreted alongside other data. A thermal camera shows surface heat patterns, a visual camera records physical context, and LiDAR captures three-dimensional geometry. Combining these sensors helps relate a detected anomaly to a specific component or structure. The right configuration depends on the asset and the inspection question.
Solar farms show the value of this approach. Drone thermography can highlight faults from the string level down to individual cells, helping teams narrow review to specific panel areas. Aerial thermal imaging kits can detect panel hot spots from 50 meters above ground. A cluster defect may cause a 33 percent power reduction in a solar panel, making precise location data useful for prioritizing investigation.
Each sensor contributes different evidence:
- Thermal imaging identifies surface temperature patterns that may indicate an anomaly.
- Visual capture adds context, such as visible damage or the affected component’s surroundings.
- LiDAR records spatial geometry, supporting measurement and asset context where required.
These datasets complement one another, but do not answer every technical question. Thermal imaging can identify surface condition, damage, displacement, and thermal anomalies, but it does not measure wall thickness or detect subsurface flaws. A LiDAR survey adds spatial information, not a diagnosis of concealed defects. Match sensor selection to the asset’s inspection objective and planned follow-up.
For solar-panel thermography, daylight operation matters because panels should be actively generating heat. System size and usage influence how often inspections are appropriate. In power generation or building maintenance, the priority may be linking a thermal pattern to component geometry or visible surface condition. Let the planned outputs guide the capture method, rather than collecting sensor data without a defined purpose.
Precision also depends on how data is captured and organized. A multi-sensor workflow should align thermal, visual, and spatial records so reviewers can locate the same asset feature across datasets. AI-powered analysis tools can flag patterns in high-resolution imagery, while qualified interpretation assesses their relevance. This can speed review across large solar farms, but an automated flag remains a prompt for assessment, not a confirmed fault.
Select sensors according to the decision the inspection must support: locating a hot spot, documenting visible condition, or mapping an asset’s geometry. A focused survey can then provide evidence suited to maintenance planning in Dubai and across the UAE.
GEOTECH 3D: Drone Services
GEOTECH 3D provides Drone Services for projects that need aerial data capture and asset coverage in Dubai and across the UAE. For an inspection plan, define the asset, the areas to assess, and how findings will support maintenance or project decisions. This helps align the required capture with the site’s operational context.
Where inspection data needs spatial context, GIS & Surveying Services can help organize and interpret asset information. A topo survey may also be relevant when site conditions or surrounding features form part of the scope. The right combination depends on the project deliverables and the decisions the data must inform.
Contact GEOTECH 3D to discuss your project’s drone inspection requirements.
Turn inspection findings into a practical plan
Start by defining the decision your inspection needs to support. Identify the asset, areas of concern, and how the results will guide maintenance or project planning. For thermal drone inspection in the UAE, a clear scope helps align aerial data capture with site conditions and the information your team needs to act.
Consider how inspection findings will fit into existing asset records and workflows. A mapped location, clear visual reference, and well-defined follow-up action can help teams move from captured data to informed assessment. Where additional context is needed, choose survey or reality-capture inputs that complement the inspection objective.
GEOTECH 3D can discuss how its surveying and capture capabilities fit your project scope in Dubai or elsewhere in the UAE.
A focused scope gives your team a clear starting point for the next inspection decision.
Frequently Asked Questions
Need Safe & Accurate Drone Inspection Services in the UAE?
GEOTECH 3D provides Drone Services for aerial inspection and surveying in Dubai and the UAE. A project scope should identify the asset, inspection objective, access constraints, and expected data outputs. Commercial drone operations require operator approval and site-specific flight permissions in the UAE. Planning those requirements alongside the asset’s operating conditions helps define a practical inspection workflow and supports controlled data capture.
What industries benefit from drone thermography?
Oil and gas, power generation, utilities, construction, and infrastructure can use drone thermography to assess visible surface conditions. An industrial facility, for example, may use thermal and visual capture to review accessible equipment, while a solar operator may examine panel heat patterns. Because objectives vary by asset, define coverage around the operational question and the information maintenance or project staff need.
What technology do these drones use?
Inspection UAVs can carry thermal infrared sensors alongside visual cameras, with LiDAR added when spatial data is required. GEOTECH 3D’s company profile identifies the DJI Zenmuse H20T multi-sensor payload as an example of its drone technology. Sensor choice depends on the required evidence: thermal data records heat patterns, visual imagery documents context, and LiDAR supports spatial capture rather than diagnosing a thermal issue.
Why Is Solar Panels Drone Thermography Inspection Important?
Solar-panel thermography helps operations teams locate unusual heat patterns across an array, supporting targeted review rather than reliance on general output readings alone. During commissioning, for example, inspection findings can contribute to assessing whether a plant is ready to begin operation. Results are most useful when linked to panel locations and reviewed alongside operating context, so follow-up can focus on relevant sections.
Which UAE companies offer thermal drone inspection services?
GEOTECH 3D offers Drone Services that include aerial inspection and thermal inspection, serving projects in Dubai and the UAE. Its broader geospatial capabilities include GIS & Surveying Services and 3D Laser Scanning, which can provide related survey or reality-capture inputs when the project scope calls for them. For an inspection discussion, define the asset type, location, coverage priorities, and intended use of the findings.
What types of thermal cameras and drones are used for inspections?
Inspection platforms use UAVs carrying thermal infrared sensors, often alongside visual imaging for asset context. GEOTECH 3D’s company profile names the DJI Zenmuse H20T multi-sensor payload. Selection should reflect the target asset, required coverage, and reporting purpose, rather than a model name alone. Solar arrays, building envelopes, and industrial structures each require different capture plans and image interpretation priorities.
How does drone thermal inspection compare with handheld or helicopter inspections?
A handheld thermal camera suits close examination of accessible components, while a drone can capture aerial views across elevated or extensive assets. Helicopters can cover broad areas, but a UAV inspection can provide a more targeted capture plan for selected structures or equipment. The right method depends on access, coverage needs, and required detail. Thermal imagery still needs interpretation and may require close inspection afterward.
Thermal drone inspections can cover large or difficult-to-access assets faster than traditional methods, while keeping personnel on the ground. For thermal drone inspection in the UAE, aerial imaging can help identify heat anomalies without relying on access methods such as scaffolding or rope access. Traditional inspections may still be needed when the task requires close physical assessment or investigation beyond what surface imagery can show.
Inspection data is most useful when it is both comprehensive and practical to act on. A drone survey can capture more of an asset and, where needed, combine thermal imagery with other sensor data. This guide compares thermal and multi-sensor drone inspections with traditional methods, explains what affects coverage, and shows how structured reporting can support maintenance planning in Dubai and across the UAE.
Key Takeaways
- Understand where aerial thermal inspections can reduce access demands compared with traditional inspection methods.
- Learn how thermal findings can be organized into reports that support maintenance prioritization and follow-up.
- Explore the industrial and infrastructure assets that can benefit from UAV-based inspection coverage.
- See how combining thermal imaging with other sensors can provide broader context for asset assessment.
- Identify when GEOTECH 3D’s Drone Services and related surveying capabilities can support inspection planning in Dubai and the UAE.
How does drone-based thermal inspection compare to traditional methods?
Drone-based thermal inspections can survey broad or elevated assets without placing personnel at every inspection point. Traditional methods may require scaffolding, shutdowns, or rope access, adding access planning and exposing teams to operational hazards. Thermal drone inspection in the UAE can combine aerial heat imaging with visual capture to help identify areas for closer assessment.
Thermal imaging records temperature patterns across visible surfaces. On a building façade, an unusual pattern may indicate possible heat loss, insulation failure, moisture intrusion, or another thermal anomaly. It highlights an area for investigation, but does not prove the cause of a leak or confirm a concealed defect. Engineers interpret the pattern alongside building details and site conditions.
For solar panels, thermal images can reveal uneven heating that warrants follow-up. Useful capture conditions depend on the inspection objective. Solar-panel thermography is best performed during daylight, while panels are actively generating heat. Visual images add context, such as panel layout, surface damage, or the location of a flagged area. Together, thermal and visual data help teams distinguish an anomaly from its physical surroundings.
Thermal cameras identify heat differences, while LiDAR records three-dimensional spatial information. When the task requires both, these sensors can relate a thermal finding to an asset’s geometry. Thermal images show surface temperature patterns, so they may not reveal all conditions within a wall. In façade leakage investigations, it can identify surface temperature patterns for targeted inspection, but suitable conditions and follow-up methods are needed to determine whether water is present.
Commercial drone operations in the UAE require GCAA operator approval and site-specific permissions for each flight. Federal Decree-Law No. (26), issued on 26 September 2022, concerns regulation of the civil use of unmanned aircraft and related activities, according to the General Civil Aviation Authority (GCAA) of the UAE.
To arrange an inspection, define the asset, suspected fault, required coverage, and intended use of the results. The inspection team can plan sensor selection, flight paths, access, and data outputs around those requirements. A façade assessment focused on heat patterns, for example, differs from a solar survey that needs panel-level thermal and visual coverage.
Accuracy depends on camera resolution, capture distance, surface properties, operating conditions, and interpretation quality. Thermal imagery can identify patterns or anomalies on solar panels, buildings, and power lines, but does not establish the cause of every fault. Wind, changing cloud cover, glare, obstructions, and uneven heating can affect image quality. Teams also plan for nearby people, restricted access, privacy-sensitive areas, and secure handling of captured imagery.
Thermal inspection reporting and maintenance planning
A useful thermal report turns aerial observations into findings that maintenance teams can locate, review, and prioritize. In the UAE, reports can document detected thermal patterns and support planning for follow-up inspections or repairs.
Qualified Interpretation of Findings
Thermal images show temperature differences, not automatic diagnoses. Interpretation should connect each anomaly to its asset, location, visual context, and inspection purpose. A warm area on a solar panel, for example, may warrant investigation, but the image alone does not establish the underlying defect or its cause.
A clear report separates observed evidence from interpretation. It identifies where each finding appears, describes the pattern, and explains why further assessment may be appropriate. This helps maintenance teams avoid treating every thermal variation as a confirmed failure and gives engineers a practical basis for deciding which locations need closer examination.
Thermal Data and Performance Reports
Performance reporting organizes thermal observations so teams can compare locations and understand asset condition. For a solar installation, findings can be grouped by array area or panel location and linked to visual references. For a building, the report can identify façade zones with distinct thermal patterns. Clear location references and consistent interpretation are essential to the report’s value.
The Al Dhafra Solar Park inspection report was generated in 10 days. That example shows how a reporting deliverable can follow aerial data capture, while the project’s required coverage and analysis shape the work involved. A report should make its findings usable for maintenance planning, rather than presenting thermal images without enough context to act on them.
AI-assisted analysis tools can help detect and flag anomalies across large image sets. High-resolution visual and thermal data give reviewers additional context, but automated flags still need qualified interpretation. Assess a suspected defect against the asset’s location and inspection objective before turning it into a maintenance action. This helps teams distinguish review priorities from confirmed faults.
Teams can use report findings to organize work into immediate investigation, scheduled follow-up, and continued monitoring. A thermal anomaly near a critical component may warrant different attention from an isolated pattern with no operational context. Maintenance staff can connect each action to a location and documented observation, reducing ambiguity during handover.
Scaffolding or other access methods may still be needed for close physical assessment or repair. Drone inspection services can help identify where such access may be most useful, rather than treating aerial data as a substitute for every inspection task. A coordinated geospatial data workflow can help keep captured findings organized for subsequent review and planning.
UAV inspection of industrial and infrastructure assets
UAV inspections can capture visual and thermal information across industrial sites, utilities, and large infrastructure. Their usefulness depends on the asset, the inspection objective, and how teams will use the resulting data.
Inspections of Difficult-to-Reach Assets
For flare stacks and cooling towers, scaffolding in the UAE can take two to four weeks. A UAV can capture aerial views and help identify visible damage or thermal anomalies without placing inspectors at height during initial data collection. This can be useful when access is difficult or the location is hazardous.
Power lines, wind turbines, oil rigs, and industrial facilities each present different coverage challenges. Flight planning defines the areas to capture and the viewpoints needed for assessment. RTK-enabled UAV platforms support industrial asset inspections, while georeferenced imagery links observations to their locations. Reports can then direct attention to specific components for closer assessment.
Live Asset Inspections Without Shutdowns
UAV data capture can assess accessible exterior areas while an asset remains operational, where the flight plan and site conditions allow. For example, aerial inspection can document external conditions at a power station without making shutdown the default requirement for visual capture. A flight does not replace procedures required for work near energized equipment or other operational hazards.
At a 300 kW-level power station, aerial hot-spot detection is one example of using thermal data to identify areas for review. The inspection objective should define which equipment is visible, which thermal patterns matter, and how findings will be reported. Thermal imagery can flag anomalies, while qualified follow-up determines their operational significance.
Industrial UAV work can cover solar panels, wind turbines, oil rigs, power lines, and large infrastructure projects. For bridges and railways, georeferenced visual and thermal imagery can help locate potential faults down to the centimeter. This imagery supports targeted assessment, but does not measure wall thickness or reveal subsurface flaws.
Construction teams can coordinate aerial asset capture with construction surveys. A survey establishes site or structure context, while inspection imagery documents visible conditions at selected assets. Combining these datasets can help project teams relate observed conditions to mapped locations and construction records. Each dataset serves a distinct purpose, so survey measurements should not be treated as thermal findings.
For a multi-sensor inspection, the team defines coverage, sensor requirements, access constraints, and report outputs before planning the flight. LiDAR-supported surveys can add spatial context when needed. This approach makes findings easier to locate and review while keeping the inspection focused on the asset’s maintenance or construction question.
Inspection coverage of powerlines, flare stacks, chimneys, boilers, and tanks
Coverage planning starts by defining the asset, its visible components, and the inspection objective. For power lines, the flight plan can organize capture by route section, tower, and accessible equipment. Flare stacks and chimneys need viewpoints that document visible surfaces and attachments. Boilers and tanks require a scope suited to their shape, operating context, and accessible exterior areas.
At power plants and substations, teams can group coverage by equipment area, such as transformers, insulators, or external structures. Thermal imaging can help identify unusual heat patterns on visible components, while visual cameras record surrounding context. Linking observations to asset locations gives operations teams a clearer basis for assessing findings and deciding where further examination is useful.
Powerline inspections benefit from consistent records for each tower and span. Thermal or visual observations can be associated with a location and relevant component, allowing maintenance teams to review findings in route order. This supports prioritization without treating every captured variation as a confirmed defect. The inspection scope should reflect network maintenance objectives and the components visible during capture.
Flare stacks and chimneys can be documented from planned viewpoints around their accessible exterior surfaces. For boilers and tanks, the capture plan should account for obstructions and areas needing closer examination. Specialist drones can access storage tanks and other areas, reducing the need for inspectors to enter dangerous confined spaces. Aerial data can guide follow-up, but does not replace every close physical examination.
AI-powered analysis tools can help flag patterns in large sets of inspection images for review. Analysts can assess those flags alongside thermal imagery, visual context, and the asset’s location. For example, a flagged area on a substation component can be linked to its recorded image and equipment reference. Automated detection supports review, but does not independently establish a fault or its cause.
For infrastructure inspections in Dubai and across the UAE, reports should organize findings around identifiable assets and maintenance priorities. Teams can group powerline observations by tower and plant findings by unit or structure. This makes later review more coherent and supports comparison across inspection records. The capture plan should address the operational question, whether that means assessing a specific component or documenting broader asset condition.
Thermal and multi-sensor drone inspections
Thermal imaging is most useful when its findings can be interpreted alongside other data. A thermal camera shows surface heat patterns, a visual camera records physical context, and LiDAR captures three-dimensional geometry. Combining these sensors helps relate a detected anomaly to a specific component or structure. The right configuration depends on the asset and the inspection question.
Solar farms show the value of this approach. Drone thermography can highlight faults from the string level down to individual cells, helping teams narrow review to specific panel areas. Aerial thermal imaging kits can detect panel hot spots from 50 meters above ground. A cluster defect may cause a 33 percent power reduction in a solar panel, making precise location data useful for prioritizing investigation.
Each sensor contributes different evidence:
- Thermal imaging identifies surface temperature patterns that may indicate an anomaly.
- Visual capture adds context, such as visible damage or the affected component’s surroundings.
- LiDAR records spatial geometry, supporting measurement and asset context where required.
These datasets complement one another, but do not answer every technical question. Thermal imaging can identify surface condition, damage, displacement, and thermal anomalies, but it does not measure wall thickness or detect subsurface flaws. A LiDAR survey adds spatial information, not a diagnosis of concealed defects. Match sensor selection to the asset’s inspection objective and planned follow-up.
For solar-panel thermography, daylight operation matters because panels should be actively generating heat. System size and usage influence how often inspections are appropriate. In power generation or building maintenance, the priority may be linking a thermal pattern to component geometry or visible surface condition. Let the planned outputs guide the capture method, rather than collecting sensor data without a defined purpose.
Precision also depends on how data is captured and organized. A multi-sensor workflow should align thermal, visual, and spatial records so reviewers can locate the same asset feature across datasets. AI-powered analysis tools can flag patterns in high-resolution imagery, while qualified interpretation assesses their relevance. This can speed review across large solar farms, but an automated flag remains a prompt for assessment, not a confirmed fault.
Select sensors according to the decision the inspection must support: locating a hot spot, documenting visible condition, or mapping an asset’s geometry. A focused survey can then provide evidence suited to maintenance planning in Dubai and across the UAE.
GEOTECH 3D: Drone Services
GEOTECH 3D provides Drone Services for projects that need aerial data capture and asset coverage in Dubai and across the UAE. For an inspection plan, define the asset, the areas to assess, and how findings will support maintenance or project decisions. This helps align the required capture with the site’s operational context.
Where inspection data needs spatial context, GIS & Surveying Services can help organize and interpret asset information. A topo survey may also be relevant when site conditions or surrounding features form part of the scope. The right combination depends on the project deliverables and the decisions the data must inform.
Contact GEOTECH 3D to discuss your project’s drone inspection requirements.
Turn inspection findings into a practical plan
Start by defining the decision your inspection needs to support. Identify the asset, areas of concern, and how the results will guide maintenance or project planning. For thermal drone inspection in the UAE, a clear scope helps align aerial data capture with site conditions and the information your team needs to act.
Consider how inspection findings will fit into existing asset records and workflows. A mapped location, clear visual reference, and well-defined follow-up action can help teams move from captured data to informed assessment. Where additional context is needed, choose survey or reality-capture inputs that complement the inspection objective.
GEOTECH 3D can discuss how its surveying and capture capabilities fit your project scope in Dubai or elsewhere in the UAE.
A focused scope gives your team a clear starting point for the next inspection decision.
Frequently Asked Questions
Need Safe & Accurate Drone Inspection Services in the UAE?
GEOTECH 3D provides Drone Services for aerial inspection and surveying in Dubai and the UAE. A project scope should identify the asset, inspection objective, access constraints, and expected data outputs. Commercial drone operations require operator approval and site-specific flight permissions in the UAE. Planning those requirements alongside the asset’s operating conditions helps define a practical inspection workflow and supports controlled data capture.
What industries benefit from drone thermography?
Oil and gas, power generation, utilities, construction, and infrastructure can use drone thermography to assess visible surface conditions. An industrial facility, for example, may use thermal and visual capture to review accessible equipment, while a solar operator may examine panel heat patterns. Because objectives vary by asset, define coverage around the operational question and the information maintenance or project staff need.
What technology do these drones use?
Inspection UAVs can carry thermal infrared sensors alongside visual cameras, with LiDAR added when spatial data is required. GEOTECH 3D’s company profile identifies the DJI Zenmuse H20T multi-sensor payload as an example of its drone technology. Sensor choice depends on the required evidence: thermal data records heat patterns, visual imagery documents context, and LiDAR supports spatial capture rather than diagnosing a thermal issue.
Why Is Solar Panels Drone Thermography Inspection Important?
Solar-panel thermography helps operations teams locate unusual heat patterns across an array, supporting targeted review rather than reliance on general output readings alone. During commissioning, for example, inspection findings can contribute to assessing whether a plant is ready to begin operation. Results are most useful when linked to panel locations and reviewed alongside operating context, so follow-up can focus on relevant sections.
Which UAE companies offer thermal drone inspection services?
GEOTECH 3D offers Drone Services that include aerial inspection and thermal inspection, serving projects in Dubai and the UAE. Its broader geospatial capabilities include GIS & Surveying Services and 3D Laser Scanning, which can provide related survey or reality-capture inputs when the project scope calls for them. For an inspection discussion, define the asset type, location, coverage priorities, and intended use of the findings.
What types of thermal cameras and drones are used for inspections?
Inspection platforms use UAVs carrying thermal infrared sensors, often alongside visual imaging for asset context. GEOTECH 3D’s company profile names the DJI Zenmuse H20T multi-sensor payload. Selection should reflect the target asset, required coverage, and reporting purpose, rather than a model name alone. Solar arrays, building envelopes, and industrial structures each require different capture plans and image interpretation priorities.
How does drone thermal inspection compare with handheld or helicopter inspections?
A handheld thermal camera suits close examination of accessible components, while a drone can capture aerial views across elevated or extensive assets. Helicopters can cover broad areas, but a UAV inspection can provide a more targeted capture plan for selected structures or equipment. The right method depends on access, coverage needs, and required detail. Thermal imagery still needs interpretation and may require close inspection afterward.
Search Now
Error: Contact form not found.